

|
|

|
Промышленный лизинг
Методички
that the elimination of the main distorting effects of the intraday periodicity may bring out new features of the volatility process that were difficult to untangle prior to filtration. First, we briefly summarize the main characteristics of the filtered series. While the mean and the standard deviation of these returns are virtually unchanged from Table la, both skewness and kurtosis are generally reduced by filtering the returns. For instance, the 5-minute skewness and kurtosis for Rt n equal 0.175 and 15.8, respectively. Interestingly, the evidence for negative return autocorrelations at the very highest frequencies becomes even more pronounced following the filtration, as measured by p, = -0.090 for the 5-minute returns. At the same time the first order absolute 5-minute return autocorrelations decline slightly to p,A = 0.292 39. The correlation structure for the absolute 5-minute filtered returns is further illustrated in Fig. 7a. The upper curves represent the correlogram for the raw returns, while the middle curves are for the filtered returns. The dramatic reduction in the periodic pattern is particularly striking for the longest lags. However, from the daily peaks in the 5 day correlogram it is clear that some periodicity remains, suggesting the presence of a stochastic periodic, or market specific, component in the intraday volatility 40. Note also that the correlations for \R,n\ at the daily frequencies are always below the correlations for the raw absolute returns, /?, . This is consistent with the predictions from Eq. (5). More direct evidence is provided by the estimated MA(1)-GARCH(1, 1) models reported in Table 4a. Compared to the results in Table 2a, the volatility parameters now display a much more coherent pattern across the return frequencies 41. In accord with the theoretical aggregation results the estimates for a(t) + fi(k) increase almost monotonically from the \ day to the 2 hour frequency. For the higher frequencies the theoretical predictions again begin to falter, however, although less starkly than before. The sum a(jt) + /3(i) remains high, but no longer increases monotonically and more importantly, a(it) starts to increase while /3(Jt) generally declines. These findings again should be interpreted in light of the absolute return autocorrelograms in Fig. 7a. The most striking feature is the initial rapid decay in the autocorrelations, followed by an extremely slow rate of decay thereafter. This pattern is not consistent with the exponential decay associated with a GARCHO, 1) model for the 5-minute returns. Instead, these findings point to a slow hyperbolic rate of decay in the autocorrelation structure for the absolute returns, which is consistent with the presence of long-memory features in the See Andersen and Bollerslev for extensive documentation of the summary statistics for both filtered and standardized returns. 40 The distinction between heat wave, or market specific, volatility as opposed to meteor shower, or global, volatility clustering was first discussed in Engle et al. (1990). This finding also points to the potential gains of more general dynamic periodic volatility type modeling (see e.g. Bollerslev and Ghysels, 1996). 41 To conserve space, we do not report the half life or the mean and median lags. 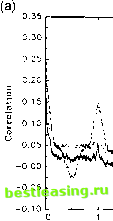 Five Days Correlogram Raw Rla Filtered R(n - Standardized R v v V V Daily Lag Forty Days Correlogram 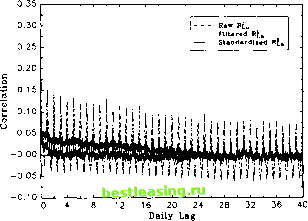 Fig. 7. Absolute returns, (a) DM-$, (b) S&P 500. volatility process (see e.g. Baillie et al., 1996; Dacorogna et al., 1993; Ding et al., 1993). Note again the slightly higher peaks associated with the weekly frequencies. Although the GARCH(l, 1) estimates for the high frequency filtered returns defy the theoretical predictions, the results are encouraging in terms of our ability to recover meaningful intraday volatility dynamics. In particular, by eliminating the deterministic periodicity we were able to uncover an interesting pattern in the absolute return correlogram which was largely invisible prior to the periodic filtering. A detailed investigation of the source of this phenomenon is well beyond o.+o 0.35 0.30 0.25 с □ 3 0.20 Five Days Correlogram - Raw SiiU Filtered R( - Standardized Rn 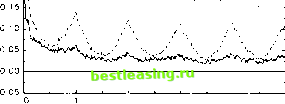 Daily Lag Forty Days Correlogram 0.40 0.35 0.30 0.25 1 3 0.20 £ t 0.15 о 0.10 0.05 0.00 -0.05 - Raw R{ mtered R{ - Standardized Ra ! 111. V W ,;Wn..i, 4. 4 8 12 16 20 24 28 32 36 40 Daily Lag Fig. 7 (continued). the scope of the present paper. However, we conjecture that the following factors have some impact on the observed correlation patterns. First, there may well be some positively cyclical correlated components left in the \R,J series, thus inducing spurious short-run dynamics in the return volatility. Second, and more importantly, the results also point to the potential importance of several distinct intraday volatility processes governed by e.g. economic announcements, the release of economic statistics, etc. each of which inherently may be of a less persistent nature than the volatility caused by changing trends in fundamental 1 2 3 4 5 6 7 8 9 [ 10 ] 11 12 13 14 15 |