

|
|

|
Промышленный лизинг
Методички
7 The initial observation on March 14, 1979 for the exchange rates corresponds to the beginning of the EMS. The Standard 90 was replaced by the broader S and P 500 composite index on January 2, 1953. Also, for reasons discussed below, the estimates for the S and P 500 data exclude the October 1987 crash period. 8 Assuming the returns to be uncorrected, the standard deviation for the mean equals 0.047/(74,880)1/2 = 0.000172%. 9 The standard errors of these statistics in their corresponding asymptotic normal distributions are (6/D1/2 and (24/Dl/2, or 0.009 and 0.018, respectively (see e.g. Jarque and Bera, 1987). 10 The coefficient is small in an economic sense but given the large sample size it is highly statistically significant. Bollerslev and Domowitz (1993) also report a negative first order autocorrelation in 5-minute DM-$ returns over 3 months in 1989, but find the correlation for artificially constructed 5-minute pseudo transactions price returns to be positive. This is counter to Ito and Roley (1987) who found evidence for systematic dollar appreciation during the U.S. segment of the market but dollar depreciation during the European trading hours. exchange rates from March 14, 1979 through September 29, 1993 and 9,558 observations on the S&P 500 cash index from January 2, 1953 through December 31, 1990 1. All the empirical work is done in parallel, with tables and figures for the foreign exchange and equity data labelled a and b\ respectively. 2.1. The Deutschemark-U.S. dollar foreign exchange data The sample mean of the 5-minute Deutschemark appreciation of 0.000175% is indistinguishable from zero at standard significance levels given the sample standard deviation of 0.047% 8. However, the returns are clearly not normally distributed. For example, the sample skewness of 0.367 and the sample kurtosis of 21.5 are both highly statistically significant 9. At the same time, the maximum and minimum 5-minute returns of 1.24% and -0.637% do not suggest the presence of sharp discontinuities in the series. A small negative first order autocorrelation coefficient of -0.04 provides some support for the hypothesis that foreign exchange dealers position their quotes asymmetrically relative to the perceived true market price as a way to manage their inventory positions, thus causing the midpoint of the quoted prices to move around in a fashion similar to the bid-ask bounce often observed on organized exchanges 10. A more detailed set of summary statistics are available in Andersen and Bollerslev (1994). In order to evaluate the intraday periodicity of the returns, Fig. la plots the average sample mean for each 5-minute interval. The average returns are centered around zero but numerous violations of the constant 5% confidence band for the null of an i.i.d. series occur between 09.00 GMT and 18.00 GMT (interval range 108 to 216). Allowing for different return sample variances across the day produces a more realistic time-varying confidence band that is violated at seemingly random points in time and at a frequency consistent with the 5% band (13 violations over 288 intervals). Thus, there appears to be little evidence for any systematic DM-$ appreciation or depreciation through the regular trading day cycle 11. 0.03 0.02 0.01 jj o.oo g?-0.01 -0.02 0 40 80 120 160 200 240 280 320 Five Minute Interval 0.03 0.02 0.01 3 0.00 OS g?-0.01 -0.02 -0.03 0 10 20 30 40 50 60 70 80 90 Five Minute Interval Fig. 1. Intraday average returns, (a) DM-$, (b) S&P 500. In contrast, the exchange rate volatility fluctuates dramatically over the daily cycle. The average absolute returns over the 5-minute intervals are depicted in Fig. 2a. It reveals a pronounced difference in the volatility over the day, ranging from a low of around 0.01% at 04.00 GMT (interval 48) to a high of around 0.05% at 15.00 GMT (interval 180) 12. This pattern is closely linked to the cycle of market activity in the various financial centers around the globe. The volatility starts out at a relatively high level followed by a slow decay up to around 03.00 GMT (interval 36). The strong drop between intervals 40 and 60 corresponds to the 12 Since the average standard error for the absolute returns is 0.0022%, these differences are highly statistically significant. 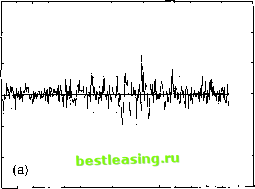 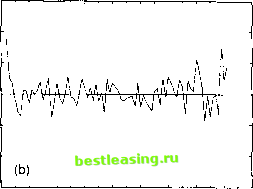 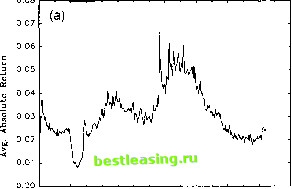 80 120 160 200 240 280 320 Five Minute Interval 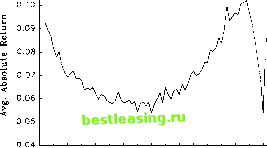 0 10 20 30 40 50 60 70 80 90 Five Minute Interval Fig. 2. Intraday average absolute returns, (a) DM-$, (b) S&P 500. lunch hour in the Tokyo and Hong Kong markets. Activity then picks up during the afternoon session in the Far Eastern markets and is further fueled by the opening of the European markets around 07.00 GMT (interval 84). The market volatility then declines slowly until the European lunch hour at 11.30 GMT (interval 138), before it increases sharply during the overlap of afternoon trading in Europe and the opening of the U.S. markets around 13.00 GMT, or 7.00 a.m. New York (interval 156). After the European markets close volatility declines monotonically until trading associated with the Far Eastern markets starts to pick up again around 21.00 GMT (interval 252). The robustness of this intraday volatility pattern is confirmed by the sub-sample analysis and the sorting of days according to volatility levels reported in the more detailed analysis in Andersen and Bollerslev (1994), which is also consistent with earlier findings in Wasser- 1 [ 2 ] 3 4 5 6 7 8 9 10 11 12 13 14 15 |