

|
|

|
Промышленный лизинг
Методички
3 We follow Dacorogna et al. (1993) in using GMT time scale throughout our analysis. Daylight savings time is observed in Europe and North America, but not in East Asia. From the sub-sample analysis in Andersen and Bollerslev (1994) this gives rise to a one hour difference in the peaks associated with the regular release of U.S. macroeconomic announcements at 08.30 a.m. corresponding to interval 162 for winter time and interval 150 for summer time. Ederington and Lee (1993) and Harvey and Huang (1991) also suggest that macroeconomic announcement effects have a distinct impact on the average volatility in early Friday morning trading in the U.S. segment of the market. We do not pursue this or any other day-of-the-week effects any further here, however. 14 The first ten autocorrelations for \R,J are 0.309, 0.256, 0.238, 0.214, 0.212, 0.199, 0.204, 0.182, 0.185 and 0.182. 15 The first ten autocorrelations of the returns are 0.009, -0.003, -0.009, 0.010, -0.004, 0.018, 0.009. 0.015, 0.013 and 0.008, respectively. The corresponding Ljung-Box statistic equals (2(10) = 87.6. 16 The impact of non-synchronous trading has been explored extensively in the literature (see e.g. Scholes and Williams, 1977; Lo and MacKinlay, 1990). fallen (1989), Muller et al. (1990), Baillie and Bollerslev (1991) and Dacorogna et al. (1993) l3. Standard summary statistics further verify the overwhelming significance of this intraday volatility pattern. In particular, the first order autocorrelation coefficient for the absolute 5-minute returns of pf1 =0.309 exceeds the 1 / JY asymptotic standard error by almost a factor of one hundred, while the Ljung-Box statistic for up to tenth order serial correlation in \Rt J equals QA(10) = 36,680 4. 2.2. The standard and poors 500 stock index futures data The basic features of the 5-minute S&P 500 are qualitatively similar to those of the 5-minute DM-$ returns. Perhaps, the most notable difference is that the standard deviation for the stock index futures return of 0.104% is more than double the value for the foreign exchange market. However, since the overnight returns for the S&P 500 are excluded, the average 5-minute standard deviation corresponds to active trading on the CME only, whereas the foreign exchange returns cover the entire 24-hour trading cycle and therefore include periods of relatively slow activity. Even so, when judged by auxiliary statistics such as the sample minimum and maximum of 2.22% and -2.76%, the equity market exhibits the more volatile returns. Another distinguishing feature is the virtual absence of autocorrelation in the futures returns. Although the first ten autocorrelation coefficients are highly significant, the coefficients are economically small and have unpredictable signs 15. This lack of correlation contrasts sharply with results reported by most studies on the intraday S&P 500 cash market, where non-synchronous trading effects imply that stale prices may enter the calculation of the index (see e.g. Chan et al., 1991) 6. The intraday periodic patterns over the eighty 5-minute intraday intervals are depicted in Fig. lb and Fig. 2b. Apart from the positive returns over the initial 5-minute interval from 8.35 to 8.40 a.m. and towards the end of the trading day, 17 This is related to the findings in Harris (1986a) who reports that the average positive returns in the equity markets tend to occur over the first 45 min of the trading day and the very last trade of the day. Notice also, that there is no indication of any abnormal positive returns after the cash market is closed. 18 This U-shaped pattern in the volatility of S&P 500 futures prices following the closure of the cash market has also recently been documented by Chang et al. (1995). the violations of the 5% confidence bands for the average returns are dispersed unpredictably over the trading day 17. Nonetheless, as was the case for the foreign exchange market, the systematic return effects are dwarfed by the systematic movements in the return volatility, here documented in Fig. 2b. The average absolute returns attain the commonly observed intraday U-shape, starting out at 0.095% in the morning, followed by a smooth decline to a level of 0.055% around noon and a steady rise to 0.105% towards the end of trading in the cash market. The subsequent drop and rise over the last fifteen minutes corresponds to the post cash market trading on the CME 18. The robustness of this intraday periodicity in the S&P 500 returns is again underscored by the more detailed analysis in Andersen and Bollerslev (1994) in which the full four year sample is divided into calendar years as well as four daily volatility categories. The only discernible difference across these sub-sample patterns is a tendency for the right part of the U to occasionally rise above the left part, creating more of a J shape. Interestingly, this tendency appears to be concentrated on high volatility days. The model proposed in Section 5 below explicitly accounts for this phenomenon. Several recent studies have attempted to rationalize the pronounced U-shape pattern in intraday stock market volatility by strategic interaction of traders around market openings and closures (see e.g. Admati and Pfleiderer, 1988, 1989; Foster and Viswanathan, 1990; Son, 1991; Brock and Kleidon, 1992). Even though the foreign exchange market operates on a continuous basis, the volatility pattern for the DM-$ depicted in Fig. 2a may be viewed, tentatively, as a sum of two overlapping U-shapes corresponding to the Far East and European trading hours, along with an inverted U-shape for the U.S. segment of the market. Hence, in spite of obvious differences in market microstructures, the foreign exchange returns are calculated from quotes in a 24-hour over-the-counter market while the equity returns are obtained from transaction prices on an organized futures market with well defined daily closings, the pattern of intraday periodicity in the two markets share important common characteristics. 3. Characterization and modeling of the correlation structure in intraday returns 3.1. Intraday return correlations While the intraday volatility patterns documented in the preceding section may be irrelevant for standard studies of the return dynamics based on price observa- tions at daily frequencies, conclusions drawn from the recent surge of empirical papers on return volatility and market microstructure variables at the intraday frequencies are likely subject to severe distortions due to the strong periodicity in returns. We therefore supplement the prior investigation of the unconditional volatility patterns with an explicit look at the dynamic features of our two return series. Fig. 3a and b display the sample autocorrelations of the 5-minute returns for up to five days i.e. 1440 observations for the foreign exchange and 400 for the equity returns. All values are small and beyond the first few lags the series resemble realizations of white noise. Thus, we again detect little of interest in the mean Five Days Correlogram 0.02 0.00 0.01 V  -0.02 -0.03 -0.04 )0 750 10 Five Minute Lag 1000 1250 1500 Five Days Correlogram 0.02 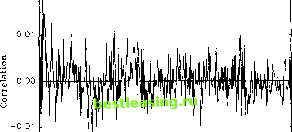 -0.02 I--1--------1---1---1 0 50 100 150 200 250 300 350 400 Five Minute Lag Fig. 3. Five days correlogram of intraday returns, (a) DM-$, (b) S&P 500. 1 2 [ 3 ] 4 5 6 7 8 9 10 11 12 13 14 15 |