

|
|

|
Промышленный лизинг
Методички
In this shopping basket, the shopper purchased a quart of orange juice, some bananas, dish detergent, some window cleaner, and a six pack of soda. 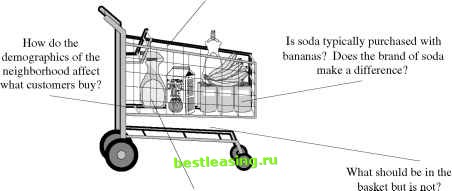 Are window cleaning products purchased when detergent and orange juice are bought together? Figure 9.1 Market basket analysis helps you understand customers as well as items that are purchased together. Association rules were originally derived from point-of-sale data that describes what products are purchased together. Although its roots are in analyzing point-of-sale transactions, association rules can be applied outside the retail industry to find relationships among other types of baskets. Some examples of potential applications are: Items purchased on a credit card, such as rental cars and hotel rooms, provide insight into the next product that customers are likely to purchase. Optional services purchased by telecommunications customers (call waiting, call forwarding, DSL, speed call, and so on) help determine how to bundle these services together to maximize revenue. Banking services used by retail customers (money market accounts, CDs, investment services, car loans, and so on) identify customers likely to want other services. Unusual combinations of insurance claims can be a sign of fraud and can spark further investigation. Medical patient histories can give indications of likely complications based on certain combinations of treatments. Association rules often fail to live up to expectations. In our experience, for instance, they are not a good choice for building cross-selling models in industries such as retail banking, because the rules end up describing previous marketing promotions. Also, in retail banking, customers typically start with a checking account and then a savings account. Differentiation among products does not appear until customers have more products. This chapter covers the pitfalls as well as the uses of association rules. The chapter starts with an overview of market basket analysis, including more basic analyses of market basket data that do not require association rules. It then dives into association rules, explaining how they are derived. The chapter then continues with ways to extend association rules to include other facets of the market basket analysis. Defining Market Basket Analysis Market basket analysis does not refer to a single technique; it refers to a set of business problems related to understanding point-of-sale transaction data. The most common technique is association rules, and much of this chapter delves into that subject. Before talking about association rules, this section talks about market basket data. Three Levels of Market Basket Data Market basket data is transaction data that describes three fundamentally different entities: Customers Orders (also called purchases or baskets or, in academic papers, item sets) Items In a relational database, the data structure for market basket data often looks similar to Figure 9.2. This data structure includes four important entities.
Figure 9.2 A data model for transaction-level market basket data typically has three tables, one for the customer, one for the order, and one for the order line. The order is the fundamental data structure for market basket data. An order represents a single purchase event by a customer. This might correspond to a customer ordering several products on a Web site or to a customer purchasing a basket of groceries or to a customer buying a several items from a catalog. This includes the total amount of the purchase, the total amount, additional shipping charges, payment type, and whatever other data is relevant about the transaction. Sometimes the transaction is given a unique identifier. Sometimes the unique identifier needs to be cobbled together from other data. In one example, we needed to combine four fields to get an identifier for purchases in a store-the timestamp when the customer paid, chain ID, store ID, and lane ID. Individual items in the order are represented separately as line items. This data includes the price paid for the item, the number of items, whether tax should be charged, and perhaps the cost (which can be used for calculating margin). The item table also typically has a link to a product reference table, which provides more descriptive information about each product. This descriptive information should include the product hierarchy and other information that might prove valuable for analysis. The customer table is an optional table and should be available when a customer can be identified, for example, on a Web site that requires registration or when the customer uses an affinity card during the transaction. Although the customer table may have interesting fields, the most powerful element is the ID itself, because this can tie transactions together over time. Tracking customers over time makes it possible to determine, for instance, which grocery shoppers bake from scratch -something of keen interest to the makers of flour as well as prepackaged cake mixes. Such customers might be identified from the frequency of their purchases of flour, baking powder, and similar ingredients, the proportion of such purchases to the customers total spending, and the lack of interest in prepackaged mixes and ready-to-eat desserts. Of course, such ingredients may be purchased at different times and in different quantities, making it necessary to tie together multiple transactions over time. All three levels of market basket data are important. For instance, to understand orders, there are some basic measures: What is the average number of orders per customer? What is the average number of unique items per order? What is the average number of items per order? For a given product, what is the proportion of customers who have ever purchased the product? 1 2 3 4 5 6 7 8 9 10 11 12 13 14 15 16 17 18 19 20 21 22 23 24 25 26 27 28 29 30 31 32 33 34 35 36 37 38 39 40 41 42 43 44 45 46 47 48 49 50 51 52 53 54 55 56 57 58 59 60 61 62 63 64 65 66 67 68 69 70 71 72 73 74 75 76 77 78 79 80 81 82 83 84 85 86 87 88 89 90 91 92 93 94 95 96 97 98 99 100 101 102 103 [ 104 ] 105 106 107 108 109 110 111 112 113 114 115 116 117 118 119 120 121 122 123 124 125 126 127 128 129 130 131 132 133 134 135 136 137 138 139 140 141 142 143 144 145 146 147 148 149 150 151 152 153 154 155 156 157 158 159 160 161 162 163 164 165 166 167 168 169 170 171 172 173 174 175 176 177 178 179 180 181 182 183 184 185 186 187 188 189 190 191 192 193 194 195 196 197 198 199 200 201 202 203 204 205 206 207 208 209 210 211 212 213 214 215 216 217 218 219 220 221 222 |
|||||||||||||||||||||||||||||||||||||||||||||||||||||