

|
|

|
Промышленный лизинг
Методички
For a given product, what is the average number of orders per customer that include the item? For a given product, what is the average quantity purchased in an order when the product is purchased? These measures give broad insight into the business. In some cases, there are few repeat customers, so the proportion of orders per customer is close to 1; this suggests a business opportunity to increase the number of sales per customers. Or, the number of products per order may be close to 1, suggesting an opportunity for cross-selling during the process of making an order. It can be useful to compare these measures to each other. We have found that the number of orders is often a useful way of differentiating among customers; good customers clearly order more often than not-so-good customers. Figure 9.3 attempts to look at the breadth of the customer relationship (the number of unique items ever purchased) by the depth of the relationship (the number of orders) for customers who purchased more than one item. This data is from a small specialty retailer. The biggest bubble shows that many customers who purchase two products do so at the same time. There is also a surprisingly large bubble showing that a sizeable number of customers purchase the same product in two orders. Better customers-at least those who returned multiple times-tend to purchase a greater diversity of goods. However, some of them are returning and buying the same thing they bought the first time. How can the retailer encourage customers to come back and buy more and different products? Market basket analysis cannot answer the question, but it can at least motivate asking it and perhaps provide hints that might help. 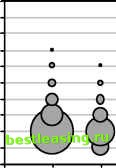 Num Orders Figure 9.3 This bubble plot shows the breadth of customer relationships by the depth of the relationship. Order Characteristics Customer purchases have additional interesting characteristics. For instance, the average order size varies by time and region-and it is useful to keep track of these to understand changes in the business environment. Such information is often available in reporting systems, because it is easily summarized. Some information, though, may need to be gleaned from transaction-level data. Figure 9.4 breaks down transactions by the size of the order and the credit card used for payment-Visa, MasterCard, or American Express-for another retailer. The first thing to notice is that the larger the order, the larger the average purchase amount, regardless of the credit card being used. This is reassuring. Also, the use of one credit card type, American Express, is consistently associated with larger orders-an interesting finding about these customers. For Web purchases and mail-order transactions, additional information may also be gathered at the point of sale: Did the order use gift wrap? Is the order going to the same address as the billing address? Did the purchaser accept or decline a particular cross-sell offer? Of course, gathering information at the point of sale and having it available for analysis are two different things. However, gift giving and responsiveness to cross-sell offers are two very useful things to know about customers. Finding patterns with this information requires collecting the information in the first place (at the call center or through the online interface) and then moving it to a data mining environment. $1,500 $1,250 $1,000 $750 $500 $250 $0 □ American Express □ MasterCard □ Visa п-п. п~п I It 3 4 5 6 Number of Items Purchased Figure 9.4 This chart shows the average amount spent by credit card type based on the number of items in the order for one particular retailer. Item Popularity What are the most popular items? This is a question that can usually be answered by looking at inventory curves, which can be generated without having to work with transaction-level data. However, knowing the sales of an individual item is only the beginning. There are related questions: What is the most common item found in a one-item order? What is the most common item found in a multi-item order? What is the most common item found among customers who are repeat purchasers? How has the popularity of particular items changed over time? How does the popularity of an item vary regionally? The first three questions are particularly interesting because they may suggest ideas for growing customer relationships. Association rules can provide answers to these questions, particularly when used with virtual items to represent the size of the order or the number of orders a customer has made. The last two questions bring up the dimensions of time and geography, which are very important for applications of market basket analysis. Different products have different affinities in different regions-something that retailers are very familiar with. It is also possible to use association rules to start to understand these areas, by introducing virtual items for region and seasonality. Time and geography are two of the most important attributes of market basket data, because they often point to the exact marketing conditions at the time of the sale. Tracking Marketing Interventions As discussed in Chapter 5, looking at individual products over time can provide a good understanding of what is happening with the product. Including marketing interventions along with the product sales over time, as in Figure 9.5, makes it possible to see the effect of the interventions. The chart shows a sales curve for a particular product. Prior to the intervention, sales are hovering at 50 units per week. After the intervention, they peak at about seven or eight times that amount, before gently sliding down over the six or seven weeks. Using such charts, it can be possible to measure the response of the marketing effort. 1 2 3 4 5 6 7 8 9 10 11 12 13 14 15 16 17 18 19 20 21 22 23 24 25 26 27 28 29 30 31 32 33 34 35 36 37 38 39 40 41 42 43 44 45 46 47 48 49 50 51 52 53 54 55 56 57 58 59 60 61 62 63 64 65 66 67 68 69 70 71 72 73 74 75 76 77 78 79 80 81 82 83 84 85 86 87 88 89 90 91 92 93 94 95 96 97 98 99 100 101 102 103 104 [ 105 ] 106 107 108 109 110 111 112 113 114 115 116 117 118 119 120 121 122 123 124 125 126 127 128 129 130 131 132 133 134 135 136 137 138 139 140 141 142 143 144 145 146 147 148 149 150 151 152 153 154 155 156 157 158 159 160 161 162 163 164 165 166 167 168 169 170 171 172 173 174 175 176 177 178 179 180 181 182 183 184 185 186 187 188 189 190 191 192 193 194 195 196 197 198 199 200 201 202 203 204 205 206 207 208 209 210 211 212 213 214 215 216 217 218 219 220 221 222 |