

|
|

|
Промышленный лизинг
Методички
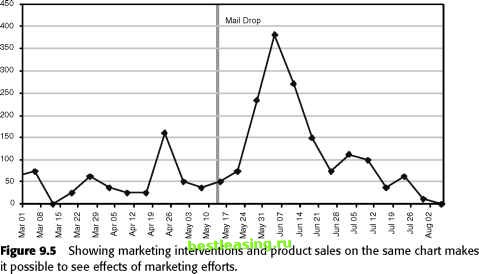 Such analysis does not require looking at individual market baskets-daily or weekly summaries of product sales are sufficient. However, it does require knowing when marketing interventions take place-and sometimes getting such a calendar is the biggest challenge. One of the questions that such a chart can answer is the effect of the intervention. A challenge in answering this question is determining whether the additional sales are incremental or are made by customers who would purchase the product anyway at some later time. Market basket data can start to answer this question. In addition to looking at the volume of sales after an intervention, we can also look at the number of baskets containing the item. If the number of customers is not increasing, there is evidence that existing customers are simply stocking up on the item at a lower cost. A related question is whether discounting results in additional sales of other products. Association rules can help answer this question by finding combinations of products that include those being promoted during the period of the promotion. Similarly, we might want to know if the average size of orders increases or decreases after an intervention. These are examples of questions where more detailed transaction level data is important. Clustering Products by Usage Perhaps one of the most interesting questions is what groups of products often appear together. Such groups of products are very useful for making recommendations to customers-customers who have purchased some of the products may be interested in the rest of them (Chapter 8 talks about product recommendations in more detail). At the individual product level, association rules provide some answers in this area. In particular, this data mining technique determines which product or products in a purchase suggest the purchase of other particular products at the same time. Sometimes it is desirable to find larger clusters than those provided by association rules, which include just a handful of items in any rule. Standard clustering techniques, which are described in Chapter 11, can also be used on market basket data. In this case, the data needs to be pivoted, as shown in Figure 9.6, so that each row represents one order or customer, and there is a flag or a counter for each product purchased. Unfortunately, there are often thousands of different products. To reduce the number of columns, such a transformation can take place at the category level, rather than at the individual product level. There is typically a lot of information available about products. In addition to the product hierarchy, such information includes the color of clothes, whether food is low calorie, whether a poster includes a frame, and so on. Such descriptions provide a wealth of information, and can lead to useful ad hoc questions: Do diet products tend to sell together? Are customers purchasing similar colors of clothing at the same time? Do customers who purchase framed posters also buy other products? Being able to answer such questions is often more useful than trying to cluster products, since such directed questions often lead directly to marketing actions. 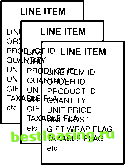 ORDER PIVOT ORDER ID HAS PRODUCT A HAS PRODUCT B HAS PRODUCT C HAS PRODUCT D etc.
Figure 9.6 Pivoting market basket data makes it possible to run clustering algorithms to find interesting groups of products. Association Rules One appeal of association rules is the clarity and utility of the results, which are in the form of rules about groups of products. There is an intuitive appeal to an association rule because it expresses how tangible products and services group together. A rule like, if a customer purchases three-way calling, then that customer will also purchase call waiting, is clear. Even better, it might suggest a specific course of action, such as bundling three-way calling with call waiting into a single service package. While association rules are easy to understand, they are not always useful. The following three rules are examples of real rules generated from real data: Wal-Mart customers who purchase Barbie dolls have a 60 percent likelihood of also purchasing one of three types of candy bars. Customers who purchase maintenance agreements are very likely to purchase large appliances. When a new hardware store opens, one of the most commonly sold items is toilet bowl cleaners. The last two examples are examples that we have actually seen in data. The first is an example quoted in Forbes on September 8, 1997. These three examples illustrate the three common types of rules produced by association rules: the actionable, the trivial, and the inexplicable. In addition to these types of rules, the sidebar Famous Rules talks about one other category. Actionable Rules The useful rule contains high-quality, actionable information. Once the pattern is found, it is often not hard to justify, and telling a story can lead to insights and action. Barbie dolls preferring chocolate bars to other forms of food is not a likely story. Instead, imagine a family going shopping. The purpose: finding a gift for little Susies friend Emily, since her birthday is coming up. A Barbie doll is the perfect gift. At checkout, little Jacob starts crying. He wants something too-a candy bar fits the bill. Or perhaps Emily has a brother; he cant be left out of the gift-giving festivities. Maybe the candy bar is for Mom, since buying Barbie dolls is a tiring activity and Mom needs some energy. These scenarios all suggest that the candy bar is an impulse purchase added onto that of the Barbie doll. Whether Wal-Mart can make use of this information is not clear. This rule might suggest more prominent product placement, such as ensuring that customers must walk through candy aisles on their way back from Barbie-land. It might suggest product tie-ins and promotions offering candy bars and dolls together. It might suggest particular ways to advertise the products. Because the rule is easily understood, it suggests plausible causes and possible interventions. 1 2 3 4 5 6 7 8 9 10 11 12 13 14 15 16 17 18 19 20 21 22 23 24 25 26 27 28 29 30 31 32 33 34 35 36 37 38 39 40 41 42 43 44 45 46 47 48 49 50 51 52 53 54 55 56 57 58 59 60 61 62 63 64 65 66 67 68 69 70 71 72 73 74 75 76 77 78 79 80 81 82 83 84 85 86 87 88 89 90 91 92 93 94 95 96 97 98 99 100 101 102 103 104 105 [ 106 ] 107 108 109 110 111 112 113 114 115 116 117 118 119 120 121 122 123 124 125 126 127 128 129 130 131 132 133 134 135 136 137 138 139 140 141 142 143 144 145 146 147 148 149 150 151 152 153 154 155 156 157 158 159 160 161 162 163 164 165 166 167 168 169 170 171 172 173 174 175 176 177 178 179 180 181 182 183 184 185 186 187 188 189 190 191 192 193 194 195 196 197 198 199 200 201 202 203 204 205 206 207 208 209 210 211 212 213 214 215 216 217 218 219 220 221 222 |