

|
|

|
Промышленный лизинг
Методички
This simple co-occurrence table already highlights some simple patterns: Orange juice and soda are more likely to be purchased together than any other two items. Detergent is never purchased with window cleaner or milk. Milk is never purchased with soda or detergent. These observations are examples of associations and may suggest a formal rule like: If a customer purchases soda, then the customer also purchases orange juice. For now, lets defer discussion of how to find the rule automatically, and instead ask another question. How good is this rule? In the data, two of the five transactions include both soda and orange juice. These two transactions support the rule. The support for the rule is two out of five or 40 percent. Since both the transactions that contain soda also contain orange juice, there is a high degree of confidence in the rule as well. In fact, two of the three transactions that contains soda also contains orange juice, so the rule if soda, then orange juice has a confidence of 67 percent percent. The inverse rule, if orange juice, then soda, has a lower confidence. Of the four transactions with orange juice, only two also have soda. Its confidence, then, is just 50 percent. More formally, confidence is the ratio of the number of the transactions supporting the rule to the number of transactions where the conditional part of the rule holds. Another way of saying this is that confidence is the ratio of the number of transactions with all the items to the number of transactions with just the if items. Another question is how much better than chance the rule is. One way to answer this is to calculate the lift (also called improvement), which tells us how much better a rule is at predicting the result than just assuming the result in the first place. Lift is the ratio of the density of the target after application of the left-hand side to the density of the target in the population. Another way of saying this is that lift is the ratio of the records that support the entire rule to the number that would be expected, assuming that there is no relationship between the products (the exact formula is given later in the chapter). A similar measure, the excess, is the difference between the number of records supported by the entire rule minus the expected value. Because the excess is measured in the same units as the original sales, it is sometimes easier to work with. Figure 9.7 provides an example of lift, confidence, and support as provided by Blue Martini, a company that specializes in tools for retailers. Their software system includes a suite of analysis tools that includes association rules. This particular example shows that a particular jacket is much more likely to be purchased with a gift certificate, information that can be used for improving messaging for selling both gift certificates and jackets. The ideas behind the co-occurrence table extend to combinations with any number of items, not just pairs of items. For combinations of three items, imagine a cube with each side split into five different parts, as shown in Figure 9.8. Even with just five items in the data, there are already 125 different subcubes to fill in. By playing with symmetries in the cube, this can be reduced a bit (by a factor of six), but the number of subcubes for groups of three items is proportional to the third power of the number of different items. In general, the number of combinations with n items is proportional to the number of items raised to the nth power-a number that gets very large, very fast. And generating the co-occurrence table requires doing work for each of these combinations. 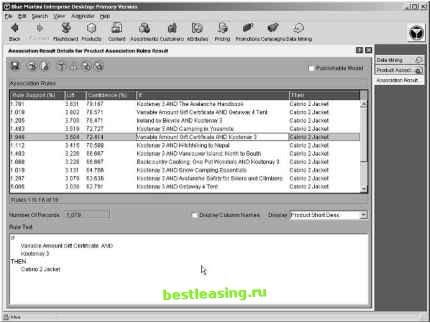 Figure 9.7 Blue Martini provides an interface that shows the support, confidence, and lift of an association rule. Detergent Soda Milk Cleaner OJ Cleaner Milk So a Detergent Soda Milk Detergent Orange juice, milk, and 1 window cleaner appear together in exactly one transaction. Figure 9.8 A co-occurrence table in three dimensions can be visualized as a cube. Building Association Rules This basic process for finding association rules is illustrated in Figure 9.9. There are three important concerns in creating association rules: Choosing the right set of items. Generating rules by deciphering the counts in the co-occurrence matrix. Overcoming the practical limits imposed by thousands or tens of thousands of items. The next three sections delve into these concerns in more detail. Team-Fly® 1 2 3 4 5 6 7 8 9 10 11 12 13 14 15 16 17 18 19 20 21 22 23 24 25 26 27 28 29 30 31 32 33 34 35 36 37 38 39 40 41 42 43 44 45 46 47 48 49 50 51 52 53 54 55 56 57 58 59 60 61 62 63 64 65 66 67 68 69 70 71 72 73 74 75 76 77 78 79 80 81 82 83 84 85 86 87 88 89 90 91 92 93 94 95 96 97 98 99 100 101 102 103 104 105 106 107 [ 108 ] 109 110 111 112 113 114 115 116 117 118 119 120 121 122 123 124 125 126 127 128 129 130 131 132 133 134 135 136 137 138 139 140 141 142 143 144 145 146 147 148 149 150 151 152 153 154 155 156 157 158 159 160 161 162 163 164 165 166 167 168 169 170 171 172 173 174 175 176 177 178 179 180 181 182 183 184 185 186 187 188 189 190 191 192 193 194 195 196 197 198 199 200 201 202 203 204 205 206 207 208 209 210 211 212 213 214 215 216 217 218 219 220 221 222 |
||||||||||||||||||||||||||||||||||||||||||||||||||||||||||||||||||||||||||||||||||||||||||||||||||||||||||||||||||||||||||||||||||||||||||||||||||||||||||||||||||||||||||||||||||||||||||||||||||||||||||||||||||||||||||||||||||||||||||||||||||||||||||||||||||||||||||||||||||||||||||||||||||||||||||||||||||||||||||||||||||||||||||||||||||||||||||||||||||||||||||||||||||||||