

|
|

|
Промышленный лизинг
Методички
Oops! These edges intersect. 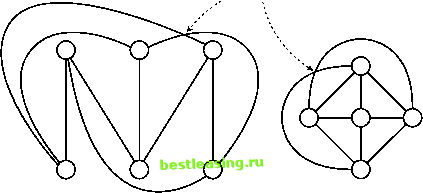 Three nodes cannot connect A fully-connected graph to three other nodes without with five nodes must also two edges crossing over have edges that intersect. each other. Figure 10.2 Not all graphs can be drawn without having some edges cross over each other. Figure 10.3 is an example of a weighted graph, one in which the edges have weights associated with them. In this case, the nodes represent products purchased by customers. The weights on the edges represent the support for the association, the percentage of market baskets containing both products. Such graphs provide an approach for solving problems in market basket analysis and are also a useful means of visualizing market basket data. This product association graph is an example of an undirected graph. The graph shows that 22.12 percent of market baskets at this health food grocery contain both yellow peppers and bananas. By itself, this does not explain whether yellow pepper sales drive banana sales or vice versa, or whether something else drives the purchase of all yellow fruits and vegetables. One very common problem in link analysis is finding the shortest path between two nodes. Which is shortest, though, depends on the weights assigned to the edges. Consider the graph of flights between cities. Does shortest refer to distance? To the fewest number of flight segments? To the shortest flight time? Or to the least expensive? All these questions are answered the same way using graphs-the only difference is the weights on the edges. The following two sections describe two classic problems in graph theory that illustrate the power of graphs to represent and solve problems. Few data mining problems are exactly like these two problems, but the problems give a flavor of how the simple construction of graphs leads to some interesting solutions. They are presented to familiarize the reader with graphs by providing examples of key concepts in graph theory and to provide a stronger basis for discussing link analysis. 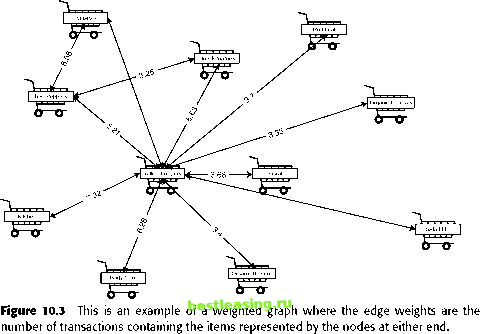 Seven Bridges of Konigsberg One of the earliest problems in graph theory originated with a simple challenge posed in the eighteenth century by the Swiss mathematician Leonhard Euler. As shown in the simple map in Figure 10.4, Konigsberg had two islands in the Pregel River connected to each other and to the rest of the city by a total of seven bridges. On either side of the river or on the islands, it is possible to get to any of the bridges. Figure 10.4 shows one path through the town that crosses over five bridges exactly once. Euler posed the question: Is it possible to walk over all seven bridges exactly once, starting from anywhere in the city, without getting wet or using a boat? As an historical note, the problem has survived longer than the name of the city. In the eighteenth century, Konigsberg was a prominent Prussian city on the Baltic Sea nestled between Lithuania and Poland. Now, it is known as Kaliningrad, the westernmost Russian enclave, separated from the rest of Russia by Lithuania and Belarus. In order to solve this problem, Euler invented the notation of graphs. He represented the map of Konigsberg as the simple graph with four vertices and seven edges in Figure 10.5. Some pairs of nodes are connected by more than one edge, indicating that there is more than one bridge between them. Finding a route that traverses all the bridges in Konigsberg exactly one time is equivalent to finding a path in the graph that visits every edge exactly once. Such a path is called an Eulerian path in honor of the mathematician who posed and solved this problem. 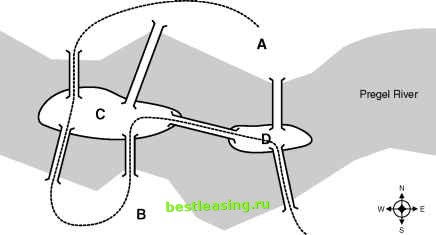 Figure 10.4 The Pregel River in Konigsberg has two islands connected by a total of seven bridges. 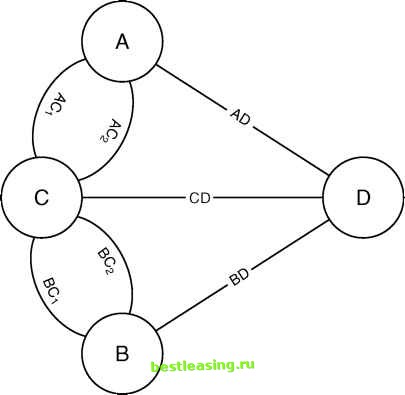 Figure 10.5 This graph represents the layout of Konigsberg. The edges are bridges and the nodes are the riverbanks and islands. 1 2 3 4 5 6 7 8 9 10 11 12 13 14 15 16 17 18 19 20 21 22 23 24 25 26 27 28 29 30 31 32 33 34 35 36 37 38 39 40 41 42 43 44 45 46 47 48 49 50 51 52 53 54 55 56 57 58 59 60 61 62 63 64 65 66 67 68 69 70 71 72 73 74 75 76 77 78 79 80 81 82 83 84 85 86 87 88 89 90 91 92 93 94 95 96 97 98 99 100 101 102 103 104 105 106 107 108 109 110 111 112 113 114 115 [ 116 ] 117 118 119 120 121 122 123 124 125 126 127 128 129 130 131 132 133 134 135 136 137 138 139 140 141 142 143 144 145 146 147 148 149 150 151 152 153 154 155 156 157 158 159 160 161 162 163 164 165 166 167 168 169 170 171 172 173 174 175 176 177 178 179 180 181 182 183 184 185 186 187 188 189 190 191 192 193 194 195 196 197 198 199 200 201 202 203 204 205 206 207 208 209 210 211 212 213 214 215 216 217 218 219 220 221 222 |