

|
|

|
Промышленный лизинг
Методички
the clusters mean. When clustering is successful, the results can be dramatic: One famous early application of cluster detection led to our current understanding of stellar evolution. Star Light, Star Bright Early in the twentieth century, astronomers trying to understand the relationship between the luminosity (brightness) of stars and their temperatures, made scatter plots like the one in Figure 11.1. The vertical scale measures luminosity in multiples of the brightness of our own sun. The horizontal scale measures surface temperature in degrees Kelvin (degrees centigrade above absolute 0, the theoretical coldest possible temperature). 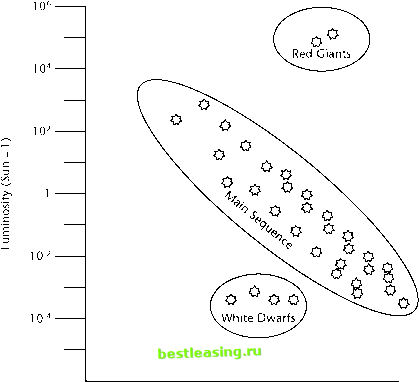 40,000 20,000 10,000 5,000 2,500 Temperature (Degrees Kelvin) Figure 11.1 The Hertzsprung-Russell diagram clusters stars by temperature and luminosity. Two different astronomers, Enjar Hertzsprung in Denmark and Norris Russell in the United States, thought of doing this at about the same time. They both observed that in the resulting scatter plot, the stars fall into three clusters. This observation led to further work and the understanding that these three clusters represent stars in very different phases of the stellar life cycle. The relationship between luminosity and temperature is consistent within each cluster, but the relationship is different between the clusters because fundamentally different processes are generating the heat and light. The 80 percent of stars that fall on the main sequence are generating energy by converting hydrogen to helium through nuclear fusion. This is how all stars spend most of their active life. After some number of billions of years, the hydrogen is used up. Depending on its mass, the star then begins fusing helium or the fusion stops. In the latter case, the core of the star collapses, generating a great deal of heat in the process. At the same time, the outer layer of gasses expands away from the core, and a red giant is formed. Eventually, the outer layer of gasses is stripped away, and the remaining core begins to cool. The star is now a white dwarf. A recent search on Google using the phrase Hertzsprung-Russell Diagram returned thousands of pages of links to current astronomical research based on cluster detection of this kind. Even today, clusters based on the HR diagram are being used to hunt for brown dwarfs (starlike objects that lack sufficient mass to initiate nuclear fusion) and to understand pre-main sequence stellar evolution. Fitting the Troops The Hertzsprung-Russell diagram is a good introductory example of clustering because with only two variables, it is easy to spot the clusters visually (and, incidentally, it is a good example of the importance of good data visualizations). Even in three dimensions, picking out clusters by eye from a scatter plot cube is not too difficult. If all problems had so few dimensions, there would be no need for automatic cluster detection algorithms. As the number of dimensions (independent variables) increases, it becomes increasing difficult to visualize clusters. Our intuition about how close things are to each other also quickly breaks down with more dimensions. Saying that a problem has many dimensions is an invitation to analyze it geometrically. A dimension is each of the things that must be measured independently in order to describe something. In other words, if there are N variables, imagine a space in which the value of each variable represents a distance along the corresponding axis in an N-dimensional space. A single record containing a value for each of the N variables can be thought of as the vector that defines a particular point in that space. When there are two dimensions, this is easily plotted. The HR diagram was one such example. Figure 11.2 is another example that plots the height and weight of a group of teenagers as points on a graph. Notice the clustering of boys and girls. Team-Ffy® The chart in Figure 11.2 begins to give a rough idea of peoples shapes. But if the goal is to fit them for clothes, a few more measurements are needed! In the 1990s, the U.S. army commissioned a study on how to redesign the uniforms of female soldiers. The armys goal was to reduce the number of different uniform sizes that have to be kept in inventory, while still providing each soldier with well-fitting uniforms. As anyone who has ever shopped for womens clothing is aware, there is already a surfeit of classification systems (even sizes, odd sizes, plus sizes, junior, petite, and so on) for categorizing garments by size. None of these systems was designed with the needs of the U.S. military in mind. Susan Ashdown and Beatrix Paal, researchers at Cornell University, went back to the basics; they designed a new set of sizes based on the actual shapes of women in the army.1 80-1  100 125 150 175 200 Weight (Pounds) Figure 11.2 Heights and weights of a group of teenagers. 1 Ashdown, Susan P. 1998. An Investigation of the Structure of Sizing Systems: A Comparison of Three Multidimensional Optimized Sizing Systems Generated from Anthropometric Data, International Journal of Clothing Science and Technology. Vol. 10, #5, pp 324-341. 1 2 3 4 5 6 7 8 9 10 11 12 13 14 15 16 17 18 19 20 21 22 23 24 25 26 27 28 29 30 31 32 33 34 35 36 37 38 39 40 41 42 43 44 45 46 47 48 49 50 51 52 53 54 55 56 57 58 59 60 61 62 63 64 65 66 67 68 69 70 71 72 73 74 75 76 77 78 79 80 81 82 83 84 85 86 87 88 89 90 91 92 93 94 95 96 97 98 99 100 101 102 103 104 105 106 107 108 109 110 111 112 113 114 115 116 117 118 119 120 121 122 123 124 [ 125 ] 126 127 128 129 130 131 132 133 134 135 136 137 138 139 140 141 142 143 144 145 146 147 148 149 150 151 152 153 154 155 156 157 158 159 160 161 162 163 164 165 166 167 168 169 170 171 172 173 174 175 176 177 178 179 180 181 182 183 184 185 186 187 188 189 190 191 192 193 194 195 196 197 198 199 200 201 202 203 204 205 206 207 208 209 210 211 212 213 214 215 216 217 218 219 220 221 222 |