

|
|

|
Промышленный лизинг
Методички
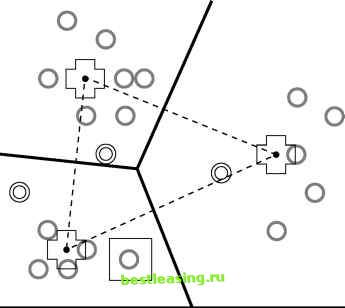 Figure 11.5 At each iteration, all cluster assignments are reevaluated. Descriptions of K-means and related algorithms gloss over the selection of K. But since, in many cases, there is no a priori reason to select a particular value, there is really an outermost loop to these algorithms that occurs during analysis rather than in the computer program. This outer loop consists of performing automatic cluster detection using one value of K, evaluating the results, then trying again with another value of K or perhaps modifying the data. After each trial, the strength of the resulting clusters can be evaluated by comparing the average distance between records in a cluster with the average distance between clusters, and by other procedures described later in this chapter. These tests can be automated, but the clusters must also be evaluated on a more subjective basis to determine their usefulness for a given application. As shown in Figure 11.6, different values of K may lead to very different clusterings that are equally valid. The figure shows clusterings of a deck of playing cards for K = 2 and K = 4. Is one better than the other? It depends on the use to which the clusters will be put. 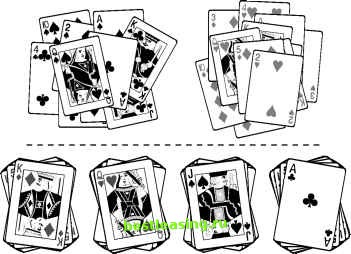 Figure 11.6 These examples of clusters of size 2 and 4 in a deck of playing cards illustrate that there is no one correct clustering. Often the first time K-means clustering is run on a given set of data, most of the data points fall in one giant central cluster and there are a number of smaller clusters outside it. This is often because most records describe normal variations in the data, but there are enough outliers to confuse the clustering algorithm. This type of clustering may be valuable for applications such as identifying fraud or manufacturing defects. In other applications, it may be desirable to filter outliers from the data; more often, the solution is to massage the data values. Later in this chapter there is a section on data preparation for clustering which describes how to work with variables to make it easier to find meaningful clusters. Similarity and Distance Once records in a database have been mapped to points in space, automatic cluster detection is really quite simple-a little geometry, some vector means, et voilal The problem, of course, is that the databases encountered in marketing, sales, and customer support are not about points in space. They are about purchases, phone calls, airplane trips, car registrations, and a thousand other things that have no obvious connection to the dots in a cluster diagram. Clustering records of this sort requires some notion of natural association; that is, records in a given cluster are more similar to each other than to records in another cluster. Since it is difficult to convey intuitive notions to a computer, this vague concept of association must be translated into some sort of numeric measure of the degree of similarity. The most common method, but by no means the only one, is to translate all fields into numeric values so that the records may be treated as points in space. Then, if two points are close in the geometric sense, they represent similar records in the database. There are two main problems with this approach: Many variable types, including all categorical variables and many numeric variables such as rankings, do not have the right behavior to properly be treated as components of a position vector. In geometry, the contributions of each dimension are of equal importance, but in databases, a small change in one field may be much more important than a large change in another field. The following section introduces several alternative measures of similarity. Similarity Measures and Variable Type Geometric distance works well as a similarity measure for well-behaved numeric variables. A well-behaved numeric variable is one whose value indicates its placement along the axis that corresponds to it in our geometric model. Not all variables fall into this category. For this purpose, variables fall into four classes, listed here in increasing order of suitability for the geometric model. Categorical variables Ranks Intervals True measures Categorical variables only describe which of several unordered categories a thing belongs to. For instance, it is possible to label one ice cream pistachio and another butter pecan, but it is not possible to say that one is greater than the other or judge which one is closer to black cherry. In mathematical terms, it is possible to tell that X Ф Y, but not whether X > Y or X < Y. Ranks put things in order, but dont say how much bigger one thing is than another. The valedictorian has better grades than the salutatorian, but we dont know by how much. If X, Y, and Z are ranked A, B, and C, we know that X > Y > Z, but we cannot define X-Y or Y-Z . Intervals measure the distance between two observations. If it is 56° in San Francisco and 78° in San Jose, then it is 22 degrees warmer at one end of the bay than the other. 1 2 3 4 5 6 7 8 9 10 11 12 13 14 15 16 17 18 19 20 21 22 23 24 25 26 27 28 29 30 31 32 33 34 35 36 37 38 39 40 41 42 43 44 45 46 47 48 49 50 51 52 53 54 55 56 57 58 59 60 61 62 63 64 65 66 67 68 69 70 71 72 73 74 75 76 77 78 79 80 81 82 83 84 85 86 87 88 89 90 91 92 93 94 95 96 97 98 99 100 101 102 103 104 105 106 107 108 109 110 111 112 113 114 115 116 117 118 119 120 121 122 123 124 125 126 [ 127 ] 128 129 130 131 132 133 134 135 136 137 138 139 140 141 142 143 144 145 146 147 148 149 150 151 152 153 154 155 156 157 158 159 160 161 162 163 164 165 166 167 168 169 170 171 172 173 174 175 176 177 178 179 180 181 182 183 184 185 186 187 188 189 190 191 192 193 194 195 196 197 198 199 200 201 202 203 204 205 206 207 208 209 210 211 212 213 214 215 216 217 218 219 220 221 222 |