

|
|

|
Промышленный лизинг
Методички
90% 80% 70% 60% 50% 40% 30% 20% 10% 0% 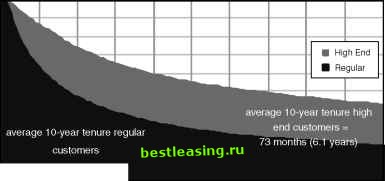 44 months (3.7 years) 36 48 60 72 Tenure (Months after Start) Figure 12.4 Average customer lifetime for different groups of customers can be compared using the areas under the retention curve. 100% ф > с ф о ф О. One very useful characteristic of the uranium is that we know-or more precisely, scientists have determined how to calculate-exactly how much uranium is going to survive after a certain amount of time. They are able to do this because they have built mathematical models that describe radioactive decay, and these have been verified experimentally. Radioactive materials have a process of decay described as exponential decay. What this means is that the same proportion of uranium turns into lead, regardless of how much time has past. The most common form of uranium, for instance, has a half-life of about 4.5 billion years. So, about half the lump of uranium has turned into lead after this time. After another 4.5 billion years, half the remaining uranium will decay, leaving only a quarter of the original lump as uranium and three-quarters as lead. WARNINGExponential decay has many useful properties for predicting beyond the range of observations. Unfortunately, customers hardly ever exhibit exponential decay. What makes exponential decay so nice is that the decay fits a nice simple equation. Using this equation, it is possible to determine how much uranium is around at any given point in time. Wouldnt it be nice to have such an equation for customer retention? It would be very nice, but it is unlikely, as shown in the example in the sidebar Parametric Approaches Do Not Work. To shed some light on the issue, lets imagine a world where customers did exhibit exponential decay. For the purposes of discussion, these customers have a half-life of 1 year. Of 100 customers starting on a particular date, exactly 50 are still active 1 year later. After 2 years, 25 are active and 75 have stopped. Exponential decay would make it easy to forecast the number of customers in the future. DETERMINING THE AREA UNDER THE RETENTION CURVE Finding the area under the retention curve may seem like a daunting mathematical effort. Fortunately, this is not the case at all. The retention curve consists of a series of points; each point represents the retention after 1 year, 2 years, 3 years, and so on. In this case, retention is measured in years; the units might also be days, weeks, or months. Each point has a value between 0 and 1, because the points represent a proportion of the customers retained up to that point in time. The following figure shows the retention curve with a rectangle holding up each point. The base of the rectangle has a length of one (measured in the units of the horizontal axis). The height is the proportion retained. The area under the curve is the sum of the areas of these rectangles. 100% 80% D 70% .> 60% 3 50% с 40% -p У 30% - - 20% - 10% 0% 0 1 2 3 4 5 6 7 8 9 1011 12 Tenure (Years) Circumscribing each point with a rectangle makes it clear how to calculate the area under the retention curve. 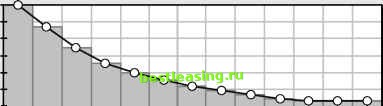 The area of each rectangle is-base times height-simply the proportion retained. The sum of all the rectangles, then, is just the sum of all the retention values in the curve-an easy calculation in a spreadsheet. Voila, an easy way to calculate the area and quite an interesting observation as well: the sum of the retention values (as percentages) is the average customer lifetime. Notice also that each rectangle has a width of one time unit, in whatever the units are of the horizontal axis. So, the units of the average are also in the units of the horizontal axis. PARAMETRIC APPROACHES DO NOT WORK It is tempting to try to fit some known function to the retention curve. This approach is called parametric statistics, because a few parameters describe the shape of the function. The power of this approach is that we can use it to estimate what happens in the future. The line is the most common shape for such a function. For a line, there are two parameters, the slope of the line and where it intersects the Y-axis. Another common shape is a parabola, which has an additional X2 term, so a parabola has three parameters. The exponential that describes radioactive decay actually has only one parameter, the half-life. The following figure shows part of a retention curve. This retention curve is for the first 7 years of data. The figure also shows three best-fit curves. Notice that all of these curves fit the values quite well. The statistical measure of fit is R2, which varies from 0 to 1. Values over 0.9 are quite good, so by standard statistical measures, all these curves fit very, very well. 100% 90% 80% 70% 60% 50% 40% 30% 20% 10% 0% 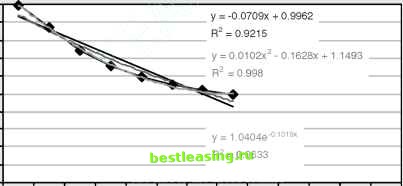 -i-I-I-I-I-I-r~ 1 2 3 4 5 6 7 8 9 10 11 12 13 Tenure (Years) It is easy to fit parametric curves to a retention curve. The real question, though is not how well these curves fit the data in the range used to define it. We want to know how well these curves work beyond the original 53-week range. The following figure answers this question. It extrapolates the curves ahead another 5 years. Quickly, the curves diverge from the actual values, and the difference seems to be growing the further out we go. Team-Fly® 1 2 3 4 5 6 7 8 9 10 11 12 13 14 15 16 17 18 19 20 21 22 23 24 25 26 27 28 29 30 31 32 33 34 35 36 37 38 39 40 41 42 43 44 45 46 47 48 49 50 51 52 53 54 55 56 57 58 59 60 61 62 63 64 65 66 67 68 69 70 71 72 73 74 75 76 77 78 79 80 81 82 83 84 85 86 87 88 89 90 91 92 93 94 95 96 97 98 99 100 101 102 103 104 105 106 107 108 109 110 111 112 113 114 115 116 117 118 119 120 121 122 123 124 125 126 127 128 129 130 131 132 133 134 135 136 137 [ 138 ] 139 140 141 142 143 144 145 146 147 148 149 150 151 152 153 154 155 156 157 158 159 160 161 162 163 164 165 166 167 168 169 170 171 172 173 174 175 176 177 178 179 180 181 182 183 184 185 186 187 188 189 190 191 192 193 194 195 196 197 198 199 200 201 202 203 204 205 206 207 208 209 210 211 212 213 214 215 216 217 218 219 220 221 222 |