
 |
 |

|
Промышленный лизинг
Методички
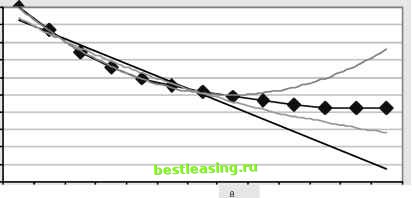
PARAMETRIC APPROACHES DO NOT WORK (continued) 100% 90% 80% 70% 60% 50% 40% 10% 0%  1 2 3 9 10 11 12 13 4 5 6 7 Tenure (Years) The parametric curves that fit a retention curve do not fit well beyond the range where they are defined. Of course, this illustration does not prove that a parametric approach will not work. Perhaps there is some function out there that, with the right parameters, would fit the observed retention curve very well and continue working beyond the range used to define the parameters. However, this example does illustrate the challenges of using a parametric approach for approximating survival curves directly, and it is consistent with our experience even when using more data points. Functions that provide a good fit to the retention curve turn out to diverge pretty quickly. Another way of describing this is that the customers who have been around for 1 year are going to behave just like new customers. Consider a group of 100 customers of various tenures, 50 leave in the following year, regardless of the tenure of the customers at the beginning of the year-exponential decay says that half are going to leave regardless of their initial tenure. That means that customers who have been around for a while are no more loyal then newer customers. However, it is often the case that customers who have been around for a while are actually better customers than new customers. For whatever reason, longer tenured customers have stuck around in the past and are probably a bit less likely than new customers to leave in the future. Exponential decay is a bad situation, because it assumes the opposite: that the tenure of the customer relationship has no effect on the rate that customers are leaving (the worst-case scenario would have longer term customers leaving at consistently higher rates than newer customers, the familiarity breeds contempt scenario). Hazards The preceding discussion on retention curves serves to show how useful retention curves are. These curves are quite simple to understand, but only in terms of their data. There is no general shape, no parametric form, no grand theory of customer decay. The data is the message. Hazard probabilities extend this idea. As discussed here, they are an example of a nonparametric statistical approach-letting the data speak instead of finding a special function to speak for it. Empirical hazard probabilities simply let the historical data determine what is likely to happen, without trying to fit data to some preconceived form. They also provide insight into customer retention and make it possible to produce a refinement of retention curves called survival curves. The Basic Idea A hazard probability answers the following question: Assume that a customer has survived for a certain length of time, so the customers tenure is t. What is the probability that the customer leaves before t+1? Another way to phrase this is: the hazard at time t is the risk of losing customers between time t and time t+1. As we discuss hazards in more detail, it may sometimes be useful to refer to this definition. As with many seemingly simple ideas, hazards have significant consequences. To provide an example of hazards, lets step outside the world of business for a moment and consider life tables, which describe the probability of someone dying at a particular age. Table 12.1 shows this data, for the U.S. population in 2000: Table 12.1 Hazards for Mortality in the United States in 2000, Shown as a Life Table
Table 12.1 (continued)
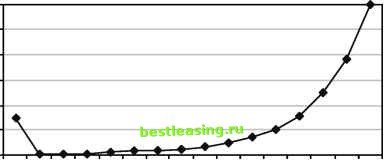
A life table is a good example of hazards. Infants have about a 1 in 137 chance of dying before their first birthday. (This is actually a very good rate; in less-developed countries the rate can be many times higher.) The mortality rate then plummets, but eventually it climbs steadily higher. Not until someone is about 55 years old does the risk rise as high as it is during the first year. This is a characteristic shape of some hazard functions and is called the bathtub shape. The hazards start high, remain low for a long time, and then gradually increase again. Figure 12.5 illustrates the bathtub shape using this data. 3.0% 2.5% 2.0% 1.5% 1.0% 0.5% 0.0%  Age (Years) Figure 12.5 The shape of a bathtub-shaped hazard function starts high, plummets, and then gradually increases again. 1 2 3 4 5 6 7 8 9 10 11 12 13 14 15 16 17 18 19 20 21 22 23 24 25 26 27 28 29 30 31 32 33 34 35 36 37 38 39 40 41 42 43 44 45 46 47 48 49 50 51 52 53 54 55 56 57 58 59 60 61 62 63 64 65 66 67 68 69 70 71 72 73 74 75 76 77 78 79 80 81 82 83 84 85 86 87 88 89 90 91 92 93 94 95 96 97 98 99 100 101 102 103 104 105 106 107 108 109 110 111 112 113 114 115 116 117 118 119 120 121 122 123 124 125 126 127 128 129 130 131 132 133 134 135 136 137 138 [ 139 ] 140 141 142 143 144 145 146 147 148 149 150 151 152 153 154 155 156 157 158 159 160 161 162 163 164 165 166 167 168 169 170 171 172 173 174 175 176 177 178 179 180 181 182 183 184 185 186 187 188 189 190 191 192 193 194 195 196 197 198 199 200 201 202 203 204 205 206 207 208 209 210 211 212 213 214 215 216 217 218 219 220 221 222 |