

|
|

|
Промышленный лизинг
Методички
The same idea can be applied to customer tenure, although customer hazards are more typically calculated by day, week, or month instead of by year. Calculating a hazard for a given tenure t requires only two pieces of data. The first is the number of customers who stopped at time t (or between t and t+1). The second is the total number of customers who could have stopped during this period, also called the population at risk. This consists of all customers whose tenure is greater than or equal to t, including those who stopped at time t. The hazard probability is the ratio of these two numbers, and being a probability, the hazard is always between 0 and 1. These hazard calculations are provided by life table functions in statistical software such as SAS and SPSS. It is also possible to do the calculations in a spreadsheet using data directly from a customer database. One caveat: In order for the calculation to be accurate, every customer included in the population count must have the opportunity to stop at that particular time. This is a property of the data used to calculate the hazards, rather than the method of calculation. In most cases, this is not a problem, because hazards are calculated from all customers or from some subset based on initial conditions (such as initial product or campaign). There is no problem when a customer is included in the population count up to that customers tenure, and the customer could have stopped on any day before then and still be in the data set. An example of what not to do is to take a subset of customers who have stopped during some period of time, say in the past year. What is the problem? Consider a customer who stopped yesterday with 2 years of tenure. This customer is included in all the population counts for the first year of hazards. However, the customer could not have stopped during the first year of tenure. The stop would have been more than a year in the past and precluded the customer from being in the data set. Because customers who could not have stopped are included in the population counts, the population counts are too big making the initial hazards too low. Later in the chapter, an alternative method is explained to address this issue. MvflTililliM To get accurate hazards and survival curves, use groups of customers who are defined only based on initial conditions. In particular, do not define the group based on how or when the members left. When populations are large, there is no need to worry about statistical ideas such as confidence and standard error. However, when the populations are small-as they are in medical research studies or in some business applications-then the confidence interval may become an issue. What this means is that a hazard of say 5 percent might really be somewhere between 4 percent and 6 percent. When working with smallish populations (say less than a few thousand), it might be a good idea to use statistical methods that provide information about standard errors. For most applications, though, this is not an important concern. Examples of Hazard Functions At this point, it is worth stopping and looking at some examples of hazards. These examples are intended to help in understanding what is happening, by looking at the hazard probabilities. The first two examples are basic, and, in fact, we have already seen examples of them in this chapter. The third is from real-world data, and it gives a good flavor of how hazards can be used to provide an x-ray of customers lifetimes. Constant Hazard The constant hazard hardly needs a picture to explain it. What it says is that the hazard of customers leaving is exactly the same, no matter how long the customers have been around. This looks like a horizontal line on a graph. Say the hazard is being measured by days, and it is a constant 0.1 percent. That is, one customer out of every thousand leaves every day. After a year (365 days), this means that about 30.6 percent of the customers have left. It takes about 692 days for half the customers to leave. It will take another 692 days for half of them to leave. And so on, and so on. The constant hazard means the chance of a customer leaving does not vary with the length of time the customer has been around. This sounds a lot like the exponential retention curve, the one that looks like the decay of radioactive elements. In fact, a constant retention hazard would conform to an exponential form for the retention curve. We say would simply because, although this does happen in physics, it does not happen much in marketing. Bathtub Hazard The life table for the U.S. population provided an example of the bathtub-shaped hazard function. This is common in the life sciences, although bathtub shaped curves turn up in other domains. As mentioned earlier, the bathtub hazard initially starts out quite high, then it goes down and flattens out for a long time, and finally, the hazards increase again. One phenomenon that causes this is when customers are on contracts (for instance, for cell phones or ISP services), typically for 1 year or longer. Early in the contract, customers stop because the service is not appropriate or because they do not pay. During the period of the contract, customers are dissuaded from canceling, either because of the threat of financial penalties or perhaps only because of a feeling of obligation to honor the terms of the initial contract. When the contract is up, customers often rush to leave, and the higher rate continues for a while because customers have been liberated from the contract. Once the contract has expired, there may be other reasons, such as the product or service no longer being competitively priced, that cause customers to stop. Markets change and customers respond to these changes. As telephone charges drop, customers are more likely to churn to a competitor than to negotiate with their current provider for lower rates. A Real-World Example Figure 12.6 shows a real-world example of a hazard function, for a company that sells a subscription-based service (the exact service is unimportant). This hazard function is measuring the probability of a customer stopping a given number of weeks after signing on. There are several interesting characteristics about the curve. First, it starts high. These are customers who sign on, but are not able to be started for some technical reason such as their credit card not being approved. In some cases, customers did not realize that they had signed on-a problem that the authors encounter most often with outbound telemarketing campaigns. Next, there is an M-shaped feature, with peaks at about 9 and 11 weeks. The first of these peaks, at about 2 months, occurs because of nonpayment. Customers who never pay a bill, or who cancel their credit card charges, are stopped for nonpayment after about 2 months. Since a significant number of customers leave at this time, the hazard probability spikes up. 7% 6% 5% 4% 3% 2% 1% 0% 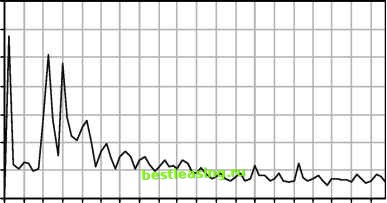 Tenure (Weeks after Start) Figure 12.6 A subscription business has customer hazard probabilities that look like this. 1 2 3 4 5 6 7 8 9 10 11 12 13 14 15 16 17 18 19 20 21 22 23 24 25 26 27 28 29 30 31 32 33 34 35 36 37 38 39 40 41 42 43 44 45 46 47 48 49 50 51 52 53 54 55 56 57 58 59 60 61 62 63 64 65 66 67 68 69 70 71 72 73 74 75 76 77 78 79 80 81 82 83 84 85 86 87 88 89 90 91 92 93 94 95 96 97 98 99 100 101 102 103 104 105 106 107 108 109 110 111 112 113 114 115 116 117 118 119 120 121 122 123 124 125 126 127 128 129 130 131 132 133 134 135 136 137 138 139 [ 140 ] 141 142 143 144 145 146 147 148 149 150 151 152 153 154 155 156 157 158 159 160 161 162 163 164 165 166 167 168 169 170 171 172 173 174 175 176 177 178 179 180 181 182 183 184 185 186 187 188 189 190 191 192 193 194 195 196 197 198 199 200 201 202 203 204 205 206 207 208 209 210 211 212 213 214 215 216 217 218 219 220 221 222 |