

|
|

|
Промышленный лизинг
Методички
Marketing literature for the home equity line product reflected this view of the likely customer, as did the lists drawn up for telemarketing. These insights led to the disappointing results mentioned earlier. Applying Data Mining BofA worked with data mining consultants from Hyperparallel (then a data mining tool vendor that has since been absorbed into Yahoo!) to bring a range of data mining techniques to bear on the problem. There was no shortage of data. For many years, BofA had been storing data on its millions of retail customers in a large relational database on a powerful parallel computer from NCR/Teradata. Data from 42 systems of record was cleansed, transformed, aligned, and then fed into the corporate data warehouse. With this system, BofA could see all the relationships each customer maintained with the bank. This historical database was truly worthy of the name-some records dating back to 1914! More recent customer records had about 250 fields, including demographic fields such as income, number of children, and type of home, as well as internal data. These customer attributes were combined into a customer signature, which was then analyzed using Hyperparallels data mining tools. A decision tree derived rules to classify existing bank customers as likely or unlikely to respond to a home equity loan offer. The decision tree, trained on thousands of examples of customers who had obtained the product and thousands who had not, eventually learned rules to tell the difference between them. Once the rules were discovered, the resulting model was used to add yet another attribute to each prospects record. This attribute, the good prospect flag, was generated by a data mining model. Next, a sequential pattern-finding tool was used to determine when customers were most likely to want a loan of this type. The goal of this analysis was to discover a sequence of events that had frequently preceded successful solicitations in the past. Finally, a clustering tool was used to automatically segment the customers into groups with similar attributes. At one point, the tool found 14 clusters of customers, many of which did not seem particularly interesting. One cluster, however, was very interesting indeed. This cluster had two intriguing properties: 39 percent of the people in the cluster had both business and personal accounts. This cluster accounted for over a quarter of the customers who had been classified by the decision tree as likely responders to a home equity loan offer. This data suggested to inquisitive data miners that people might be using home equity loans to start businesses. Acting on the Results With this new understanding, NCAG teamed with the Retail Banking Division and did what banks do in such circumstances: they sponsored market research to talk to customers. Now, the bank had one more question to ask: Will the proceeds of the loan be used to start a business? The results from the market research confirmed the suspicions aroused by data mining, so NCAG changed the message and targeting on their marketing of home equity loans. Incidentally, market research and data mining are often used for similar ends-to gain a better understanding of customers. Although powerful, market research has some shortcomings: Responders may not be representative of the population as a whole. That is, the set of responders may be biased, particularly by where past marketing efforts were focused, and hence form what is called an opportunistic sample. Customers (particularly dissatisfied customers and former customers) have little reason to be helpful or honest. For any given action, there may be an accumulation of reasons. For instance, banking customers may leave because a branch closed, the bank bounced a check, and they had to wait too long at ATMs. Market research may pick up only the proximate cause, although the sequence is more significant. Despite these shortcomings, talking to customers and former customers provides insights that cannot be provided in any other way. This example with BofA shows that the two methods are compatible. Qfj When doing market research on existing customers, it is a good idea to use data mining to take into account what is already known about them. Measuring the Effects As a result of the new campaign, Bank of America saw the response rate for home equity campaigns jump from 0.7 percent to 7 percent. According to Dave McDonald, vice president of the group, the strategic implications of data mining are nothing short of the transformation of the retail side of the bank from a mass-marketing institution to a learning institution. We want to get to the point where we are constantly executing marketing programs-not just quarterly mailings, but programs on a consistent basis. He has a vision of a closed-loop marketing process where operational data feeds a rapid analysis process that leads to program creation for execution and testing, which in turn generates additional data to rejuvenate the process. In short, the virtuous cycle of data mining. What Is the Virtuous Cycle? The BofA example shows the virtuous cycle of data mining in practice. Figure 2.1 shows the four stages: 1. Identifying the business problem. 2. Mining data to transform the data into actionable information. 3. Acting on the information. 4. Measuring the results. 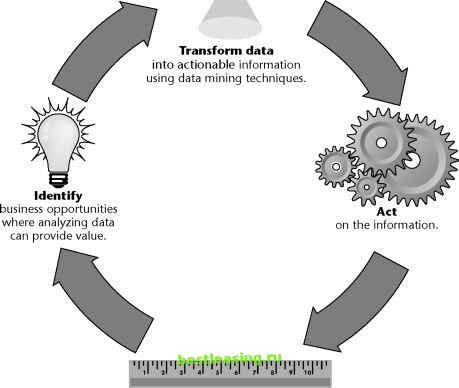 Measure the results of the efforts to complete the learning cycle. Figure 2.1 The virtuous cycle of data mining focuses on business results, rather than just exploiting advanced techniques. 1 2 3 4 5 6 7 8 9 10 11 12 13 14 15 [ 16 ] 17 18 19 20 21 22 23 24 25 26 27 28 29 30 31 32 33 34 35 36 37 38 39 40 41 42 43 44 45 46 47 48 49 50 51 52 53 54 55 56 57 58 59 60 61 62 63 64 65 66 67 68 69 70 71 72 73 74 75 76 77 78 79 80 81 82 83 84 85 86 87 88 89 90 91 92 93 94 95 96 97 98 99 100 101 102 103 104 105 106 107 108 109 110 111 112 113 114 115 116 117 118 119 120 121 122 123 124 125 126 127 128 129 130 131 132 133 134 135 136 137 138 139 140 141 142 143 144 145 146 147 148 149 150 151 152 153 154 155 156 157 158 159 160 161 162 163 164 165 166 167 168 169 170 171 172 173 174 175 176 177 178 179 180 181 182 183 184 185 186 187 188 189 190 191 192 193 194 195 196 197 198 199 200 201 202 203 204 205 206 207 208 209 210 211 212 213 214 215 216 217 218 219 220 221 222 |