

|
|

|
Промышленный лизинг
Методички
Who Are the Prospects? Understanding who prospects are is quite important because messages should be targeted to an audience of prospects. From the perspective of data mining, one of the challenges is using historical data when the prospect base changes. Here are three typical reasons why care must be used when doing prospecting: Geographic expansion brings in prospects, who may or may not be similar to customers in the original areas. Changes to products, services, and pricing may bring in different target audiences. Competition may change the prospecting mix. These are the types of situations that bring up the question: Will the past be a good predictor of the future? In most cases, the answer is yes, but the past has to be used intelligently. The following story is an example of the care that needs to be taken. One company in the New York area had a large customer base in Manhattan and was looking to expand into the suburbs. They had done direct mail campaigns focused on Manhattan, and built a model set derived from responders to these campaigns. What is important for this story is that Manhattan has a high concentration of very expensive neighborhoods, so the model set was biased toward the wealthy. That is, both the responders and nonresponders were much wealthier than the average inhabitant of the New York area. When the model was extended to areas outside Manhattan, what areas did the model choose? It chose a handful of the wealthiest neighborhoods in the surrounding areas, because these areas looked most like the historical respon-ders in Manhattan. Although there were good prospects in these areas, the model missed many other pockets of potential customers. By the way, these other pockets were discovered through the use of control groups in the mailing-essentially a random sampling of names from surrounding areas. Some areas in the control groups had quite high response rates; these were wealthy areas, but not as wealthy as the Manhattan neighborhoods used to build the model. WARNING Be careful when extending response models from one geographic area to another. The results may tell you more about similar geographies than about response. When Is a Customer Acquired? There is usually an underlying process in the acquisition of customers; the details of the process depend on the particular industry, but there are some general steps: Team-Ffy® Customers respond in some way and on some date. This is the sale date. In an account-based relationship, the account is created. This is the account open date. The account is used in some fashion. Sometimes, all these things happen at the same time. However, there are invariably complications-bad credit card numbers, misspelled addresses, buyers remorse, and so on. The result is that there may be several dates that correspond to the acquisition date. Assuming that all relevant dates are available, which is the best to use? That depends on the particular purpose. For instance, after a direct mail drop or an email drop, it might be interesting to see the response curve to know when responses are expected to come in, as shown in Figure 14.6. For this purpose, the sale date is most important date, because it indicates customer behavior and the question is about customer behavior. Whatever might cause the account open date to be delayed is not of interest. A different question would have a different answer. For comparing the response of different groups, for instance, the account open date might be more important. Prospects who register a sale but whose account never opens should be excluded from such an analysis. This is also true in applications where the goal is forecasting the number of customers who are going to open accounts. 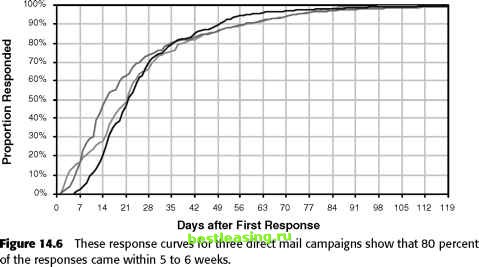 What Is the Role of Data Mining? Available data limits the role that predictive modeling can play. Predictive modeling is used for channels such as direct mail and telemarketing, where the cost of contact is relatively high. The goal is to limit the contacts to prospects that are more likely respond and become good customers. Data available for such endeavors falls into three categories: Source of prospect Appended individual/household data Appended demographic data at a geographic level (typical census block or census block group) The purpose here is to discuss prospecting from the perspective of data mining. A good place to begin is with an outline of a typical acquisition strategy. Companies that use direct mail or outbound telemarketing purchase lists. Some lists are historically very good, so they would be used in their entirety. For names from less expensive lists, one set of models is based on appended demographics, when such demographics are available at the household level. When such demographics are not available, neighborhood demographics are used instead in a different set of models. One of the challenges in direct marketing is the echo effect-prospects may be reached by one channel but come in through another. For instance, a company might send a group of prospects an email message. Instead of responding to the email on the Web, some respondents might call a call center. Or customers may receive an advertising message or direct mail, yet respond through the Web site. Or an advertising campaign may encourage responses through several different channels at the same time. Figure 14.7 shows an example of the echo effect, as shown by the correlation between two channels, inbound calls and direct mail. Another challenge is the funneling effect during customer activation described in the next section. WARNING The echo effect may artificially under- or overestimate the performance of channels, because customers inspired by one channel may be attributed to another. Customer Activation Once a prospect has exhibited an interest, there is some sort of activation process. This may be as simple as a customer filling out a registration form on a Web site. Or, it might involve a more lengthy approval process, such as a credit check. Or, it could be a bit more onerous, as in the example of life insurance companies who often want to perform an underwriting exam that might 1 2 3 4 5 6 7 8 9 10 11 12 13 14 15 16 17 18 19 20 21 22 23 24 25 26 27 28 29 30 31 32 33 34 35 36 37 38 39 40 41 42 43 44 45 46 47 48 49 50 51 52 53 54 55 56 57 58 59 60 61 62 63 64 65 66 67 68 69 70 71 72 73 74 75 76 77 78 79 80 81 82 83 84 85 86 87 88 89 90 91 92 93 94 95 96 97 98 99 100 101 102 103 104 105 106 107 108 109 110 111 112 113 114 115 116 117 118 119 120 121 122 123 124 125 126 127 128 129 130 131 132 133 134 135 136 137 138 139 140 141 142 143 144 145 146 147 148 149 150 151 152 153 154 155 156 157 158 159 160 161 [ 162 ] 163 164 165 166 167 168 169 170 171 172 173 174 175 176 177 178 179 180 181 182 183 184 185 186 187 188 189 190 191 192 193 194 195 196 197 198 199 200 201 202 203 204 205 206 207 208 209 210 211 212 213 214 215 216 217 218 219 220 221 222 |