

|
|

|
Промышленный лизинг
Методички
capabilities. The oldest manual methods are the mainframe report-generation tools whose output is traditionally printed on green bar paper or green screens. These mainframe reports automate paper-based methods that preceded computers. Producing such reports is often the primary function of IS departments. Even minor changes to the reports require modifying code that sometimes dates back decades. The result is a lag between the time when a user requests changes and the time when he or she sees the new information that is measured in weeks and months. This is old technology that organizations are generally trying to move away from, except for the lowest-level reports that summarize specific operational systems. The source of the data is usually legacy mainframe systems used for operations, but it could be a data warehouse. 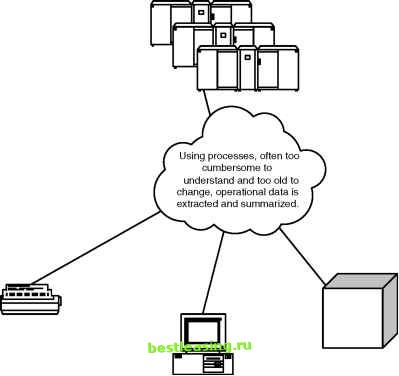 Paper-based reports from mainframe systems are part of the business process. They are usually too late and too inflexible for decision support. Off-the-shelf query tools provide users some access to the data and the ability to form their own queries. OLAP tools, based on multi dimensional cubes, give users flexible and fast access to data, both summarized and detail. Figure 15.4 Reporting requirements on operational systems are typically handled the same way they have been for decades. Is this the best way? In the middle are off-the-shelf query generation packages that have become popular for accessing data in the past decade. These generate queries in SQL and can talk to local or remote data sources using a standard protocol, such as the Open Database Connectivity (ODBC) standard. Such reports might be embedded in a spreadsheet, accessed through the Web, or through some other reporting interface. With a day or so of training, business analysts can usually generate the reports that they need. Of course, the report itself is often running as an SQL query on an already overburdened database, so response times are measured in minutes or hours, when the queries are even allowed to run to completion. These response times are much faster than the older report-generation packages, but they still make it difficult to exploit the data. The goal is to be able to ask a question and still remember the question when the answer comes back. OLAP is a significant improvement over ad hoc query systems, because OLAP systems design the data structure with users in mind. This powerful and efficient representation is called a cube, which is ideally suited for slicing and dicing data. The cube itself is stored either in a relational database, typically using a star schema, or in a special multidimensional database that optimizes OLAP operations. In addition, OLAP tools provide handy analysis functions that are difficult or impossible to express in SQL. If OLAP tools have one downside, it is that business users start to focus only on the dimensions of data represented by the tool. Data mining, on the other hand, is particularly valuable for creative thinking. Setting up the cube requires analyzing the data and the needs of the end users, which is generally done by specialists familiar with the data and the tool, through a process called dimensional modeling. Although designing and loading an OLAP system requires an initial investment, the result provides informative and fast access to end users, generally much more helpful than the results from a query-generation tool. Response times, once the cube has been built, are almost always measured in seconds, allowing users to explore data and drill down to understand interesting features that they encounter. OLAP is a powerful enhancement to earlier reporting methods. Its power rests on three key features: First, a well-designed OLAP system has a set of relevant dimensions- such as geography, product, and time-understandable to business users. These dimensions often prove important for data mining purposes. Second, a well-designed OLAP system has a set of useful measures relevant to the business. Third, OLAP systems allow users to slice and dice data, and sometimes to drill down to the customer level. Quick response times are important for getting user acceptance of reporting systems. When users have to wait, they may forget the question that they asked. Interactive response times as experienced by end users should be in the range of 3-5 seconds. These capabilities are complementary to data mining, but not a substitute for it. Nevertheless, OLAP is a very important (perhaps even the most important) part of the data warehouse architecture because it has the largest number of users. Whats in a Cube? A good way to approach OLAP is to think of data as a cube split into subcubes, as shown in Figure 15.5. Although this example uses three dimensions, OLAP can have many more; three dimensions are useful for illustrative purposes. This example shows a typical retailing cube that has one dimension for time, another for product, and a third for store. Each subcube contains various measures indicating what happened regarding that product in that store on that date, such as: Total number of items sold Total value of the items Total amount of discount on the items Inventory cost of the items The measures are called facts. As a rule of thumb, dimensions consist of categorical variables and facts are numeric. As users slice and dice the data, they are aggregating facts from many different subcubes. The dimensions are used to determine exactly which subcubes are used in the query. Even a simple cube such as the one described above is very powerful. Figure 15.6 shows an example of summarizing data in the cube to answer the question On how many days did a particular store not sell a particular product? Such a question requires using the store and product dimension to determine which subcubes are used for the query. This question only looks at one fact, the number of items sold, and returns all the dates for which this value is 0. Here are some other questions that can be answered relatively easily: What was the total number of items sold in the past year? What were the year over year sales, by month, of stores in the Northeast? What was the overall margin for each store in November? (Margin being the price paid by the customer minus the inventory cost.) 1 2 3 4 5 6 7 8 9 10 11 12 13 14 15 16 17 18 19 20 21 22 23 24 25 26 27 28 29 30 31 32 33 34 35 36 37 38 39 40 41 42 43 44 45 46 47 48 49 50 51 52 53 54 55 56 57 58 59 60 61 62 63 64 65 66 67 68 69 70 71 72 73 74 75 76 77 78 79 80 81 82 83 84 85 86 87 88 89 90 91 92 93 94 95 96 97 98 99 100 101 102 103 104 105 106 107 108 109 110 111 112 113 114 115 116 117 118 119 120 121 122 123 124 125 126 127 128 129 130 131 132 133 134 135 136 137 138 139 140 141 142 143 144 145 146 147 148 149 150 151 152 153 154 155 156 157 158 159 160 161 162 163 164 165 166 167 168 169 170 171 172 [ 173 ] 174 175 176 177 178 179 180 181 182 183 184 185 186 187 188 189 190 191 192 193 194 195 196 197 198 199 200 201 202 203 204 205 206 207 208 209 210 211 212 213 214 215 216 217 218 219 220 221 222 |