

|
|

|
Промышленный лизинг
Методички
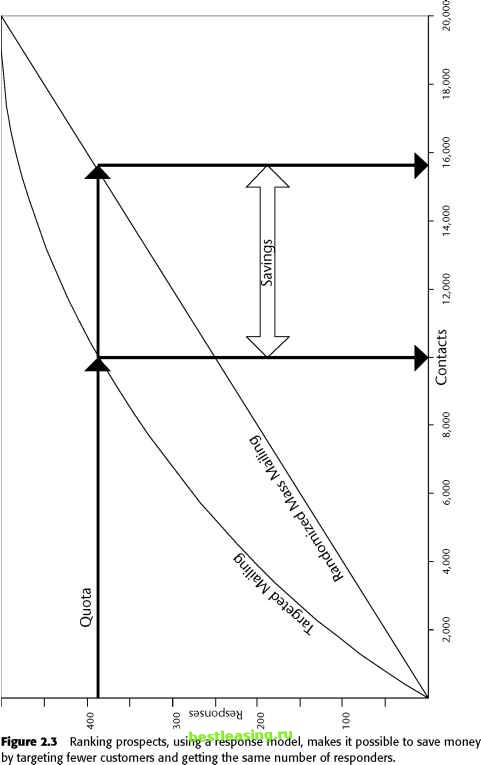 Defining the Inputs The data mining techniques described in this book automate the central core of the model building process. Given a collection of input data fields, and a target field (in this case, purchase of the new product) they can find patterns and rules that explain the target in terms of the inputs. For data mining to succeed, there must be some relationship between the input variables and the target. In practice, this means that it often takes much more time and effort to identify, locate, and prepare input data than it does to create and run the models, especially since data mining tools make it so easy to create models. It is impossible to do a good job of selecting input variables without knowledge of the business problem being addressed. This is true even when using data mining tools that claim the ability to accept all the data and figure out automatically which fields are important. Information that knowledgeable people in the industry expect to be important is often not represented in raw input data in a way data mining tools can recognize. The wireless phone company understood the importance of selecting the right input data. Experts from several different functional areas including marketing, sales, and customer support met together with outside data mining consultants to brainstorm about the best way to make use of available data. There were three data sources available: A marketing customer information file A call detail database A demographic database The call detail database was the largest of the three by far. It contained a record for each call made or received by every customer in the target market. The marketing database contained summarized customer data on usage, tenure, product history, price plans, and payment history. The third database contained purchased demographic and lifestyle data about the customers. Derived Inputs As a result of the brainstorming meetings and preliminary analysis, several summary and descriptive fields were added to the customer data to be used as input to the predictive model: Minutes of use Number of incoming calls Frequency of calls Sphere of influence Voice mail user flag Some of these fields require a bit of explanation. Minutes of use (MOU) is a standard measure of how good a customer is. The more minutes of use, the better the customer. Historically, the company had focused on MOU almost to the exclusion of all other variables. But, MOU masks many interesting differences: 2 long calls or 100 short ones? All outgoing calls or half incoming? All calls to the same number or calls to many numbers? The next items in the above list are intended to shed more light on these questions. Sphere of influence (SOI) is another interesting measure because it was developed as a result of an earlier data mining effort. A customers SOI is the number of people with whom she or he had phone conversations during a given time period. It turned out that high SOI customers behaved differently, as a group, than low SOI customers in several ways including frequency of calls to customer service and loyalty. The Actions Data from all three sources was brought together and used to create a data mining model. The model was used to identify likely candidates for the new product. Two direct mailings were made: one to a list based on the results of the data mining model and one to control group selected using business-as-usual methods. As shown in Figure 2.4, 15 percent of the people in the target group purchased the new product, compared to only 3 percent in the control group. 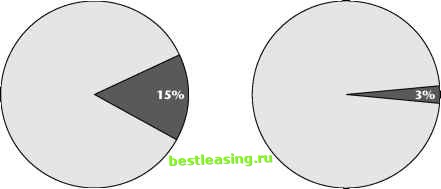 Percent of Target Market Responding Percent of Control Group Responding Figure 2.4 These results demonstrate a very successful application of data mining. 1 2 3 4 5 6 7 8 9 10 11 12 13 14 15 16 17 18 19 [ 20 ] 21 22 23 24 25 26 27 28 29 30 31 32 33 34 35 36 37 38 39 40 41 42 43 44 45 46 47 48 49 50 51 52 53 54 55 56 57 58 59 60 61 62 63 64 65 66 67 68 69 70 71 72 73 74 75 76 77 78 79 80 81 82 83 84 85 86 87 88 89 90 91 92 93 94 95 96 97 98 99 100 101 102 103 104 105 106 107 108 109 110 111 112 113 114 115 116 117 118 119 120 121 122 123 124 125 126 127 128 129 130 131 132 133 134 135 136 137 138 139 140 141 142 143 144 145 146 147 148 149 150 151 152 153 154 155 156 157 158 159 160 161 162 163 164 165 166 167 168 169 170 171 172 173 174 175 176 177 178 179 180 181 182 183 184 185 186 187 188 189 190 191 192 193 194 195 196 197 198 199 200 201 202 203 204 205 206 207 208 209 210 211 212 213 214 215 216 217 218 219 220 221 222 |