

|
|

|
Промышленный лизинг
Методички
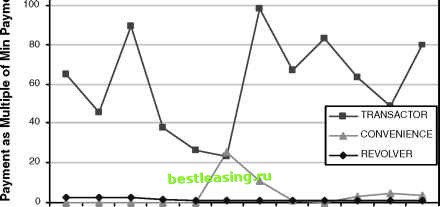 Jan Feb Mar Apr May Jun Jul Aug Sep Oct Nov Dec Figure 17.17 Comparing the amount paid as a multiple of the minimum payment shows distinct curves for transactors, revolvers, and convenience users. First, lets define the ideal convenience user. This is someone who, twice a year, charges up to his or her credit line and then pays the balance off over 4 months. There are few, if any, additional charges during the other 10 months of the year. Table 17.7 illustrates the monthly balances for two convenience users as a ratio of their credit lines. This table also illustrates one of the main challenges in the definition of convenience users. The values describing their behavior have no relationship to each other in any given month. They are out of phase. In fact, there is a fundamental difference between convenience users on the one hand and transactors and revolvers on the other. Knowing that someone is a transactor exactly describes their behavior in any given month-they pay off the balance. Knowing that someone is a convenience user is less helpful. In any given month, they may be paying nothing, paying off everything, or making a partial payment. Table 17.7 Monthly Balances of Two Convenience Users Expressed as a Percentage of Their Credit Lines
Does this mean that it is not possible to develop a measure to identify convenience users? Not at all. The solution is to sort the 12 months of data by the balance ratio and to create the convenience-user measure using the sorted data. Figure 17.18 illustrates this process. It shows the two convenience users, along with the profile of the ideal convenience user. Here, the data is sorted, with the largest values occurring first. For the first convenience user, month 1 refers to January. For the second, it refers to March. Now, using the same idea of taking the area between the ideal and the actual produces a score that measures how close a convenience user is to the ideal. Notice that revolvers would have outstanding balances near the maximum for all months. They would have high scores, indicating that they are far from the ideal convenience user. For convenience users, the scores are much smaller. This case study has shown several different ways of segmenting customers. All make use of derived variables to describe customer behavior. Often, it is possible to describe a particular behavior and then to create a score that measures how each customers behavior compares to the ideal. 100% 90% 80% 70% 60% 50% 40% 30% 20% 10% 0% 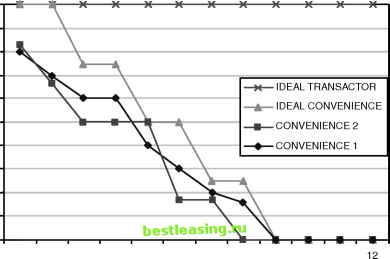 1 23456789 10 11 Month (Sorted from Highest Balance to Lowest) Figure 17.18 Comparison of two convenience users to the ideal, by sorting the months by the balance ratio. The Dark Side of Data Working with data is a critical part of the data mining process. What does the data mean? There are many ways to answer this question-through written documents, in database schemas, in file layouts, through metadata systems, and, not least, via the database administrators and systems analysis who know what is really going on. No matter how good the documentation, the real story lies in the data. There is a misconception that data mining requires perfect data. In the world of business analysis, the perfect is definitely the enemy of the sufficiently good. For one thing, exploring data and building models highlights data issues that are otherwise unknown. Starting the process with available data may not result in the best models, but it does start a process that can improve over time. For another thing, waiting for perfect data is often a way of delaying a project so that nothing gets done. This section covers some of the important issues that make working with data a sometimes painful process. Missing Values Missing values refer to data that should be there but is not. In many cases, missing values are represented as NULLs in the data source, making it easy to identify them. However, be careful: NULL is sometimes an acceptable value. In this case, we say that the value is empty rather than missing, although the two look the same in source data. For instance, the stop code of an account might be NULL, indicating that the account is still active. This information, which indicates whether data is censored or not, is critical for survival analysis. Another time when NULL is an acceptable value is when working with overlay data describing demographics and other characteristics of customers and prospects. In this case, NULL often has one of two meanings: There is not enough evidence to indicate whether the field is true for the individual. For instance, lack of subscriptions to golfing magazines suggests the person is not a golfer, but does not prove it. There is no matching record for the individual in the overlay data. When working with ovelay data, it is useful to replace NULLs with alternative values, one meaning that the record does not match and the other meaning that the value is unknown. It is worth distinguishing between these situations. One way is to separate the data where the records do not match, creating two different model sets. The other is to replace the NULL values with alternative values, indicating whether the failure to match is at the record level or the field level. 1 2 3 4 5 6 7 8 9 10 11 12 13 14 15 16 17 18 19 20 21 22 23 24 25 26 27 28 29 30 31 32 33 34 35 36 37 38 39 40 41 42 43 44 45 46 47 48 49 50 51 52 53 54 55 56 57 58 59 60 61 62 63 64 65 66 67 68 69 70 71 72 73 74 75 76 77 78 79 80 81 82 83 84 85 86 87 88 89 90 91 92 93 94 95 96 97 98 99 100 101 102 103 104 105 106 107 108 109 110 111 112 113 114 115 116 117 118 119 120 121 122 123 124 125 126 127 128 129 130 131 132 133 134 135 136 137 138 139 140 141 142 143 144 145 146 147 148 149 150 151 152 153 154 155 156 157 158 159 160 161 162 163 164 165 166 167 168 169 170 171 172 173 174 175 176 177 178 179 180 181 182 183 184 185 186 187 188 189 190 191 192 193 194 195 196 197 198 199 200 201 202 203 [ 204 ] 205 206 207 208 209 210 211 212 213 214 215 216 217 218 219 220 221 222 |