

|
|

|
Промышленный лизинг
Методички
Patterns May Not Represent Any Underlying Rule It is often said that figures dont lie, but liars can figure. When it comes to finding patterns in data, figures dont have to actually lie in order to suggest things that arent true. There are so many ways to construct patterns that any random set of data points will reveal one if examined long enough. Human beings depend so heavily on patterns in our lives that we tend to see them even when they are not there. We look up at the nighttime sky and see not a random arrangement of stars, but the Big Dipper, or, the Southern Cross, or Orions Belt. Some even see astrological patterns and portents that can be used to predict the future. The widespread acceptance of outlandish conspiracy theories is further evidence of the human need to find patterns. Presumably, the reason that humans have evolved such an affinity for patterns is that patterns often do reflect some underlying truth about the way the world works. The phases of the moon, the progression of the seasons, the constant alternation of night and day, even the regular appearance of a favorite TV show at the same time on the same day of the week are useful because they are stable and therefore predictive. We can use these patterns to decide when it is safe to plant tomatoes and how to program the VCR. Other patterns clearly do not have any predictive power. If a fair coin comes up heads five times in a row, there is still a 50-50 chance that it will come up tails on the sixth toss. The challenge for data miners is to figure out which patterns are predictive and which are not. Consider the following patterns, all of which have been cited in articles in the popular press as if they had predictive value: The party that does not hold the presidency picks up seats in Congress during off-year elections. When the American League wins the World Series, Republicans take the White House. When the Washington Redskins win their last home game, the incumbent party keeps the White House. In U.S. presidential contests, the taller man usually wins. The first pattern (the one involving off-year elections) seems explainable in purely political terms. Because there is an underlying explanation, this pattern seems likely to continue into the future and therefore has predictive value. The next two alleged predictors, the ones involving sporting events, seem just as clearly to have no predictive value. No matter how many times Republicans and the American League may have shared victories in the past (and the authors have not researched this point), there is no reason to expect the association to continue in the future. What about candidates heights? At least since 1945 when Truman (who was short, but taller than Dewey) was elected, the election in which Carter beat Ford is the only one where the shorter candidate won. (So long as winning is defined as receiving the most votes so that the 2000 election that pitted 61 Gore against the 60 Bush still fits the pattern.) Height does not seem to have anything to do with the job of being president. On the other hand, height is positively correlated with income and other social marks of success so consciously or unconsciously, voters may perceive a taller candidate as more presidential. As this chapter explains, the right way to decide if a rule is stable and predictive is to compare its performance on multiple samples selected at random from the same population. In the case of presidential height, we leave this as an exercise for the reader. As is often the case, the hardest part of the task will be collecting the data-even in the age of Google, it is not easy to locate the heights of unsuccessful presidential candidates from the eighteenth, nineteenth, and twentieth centuries! The technical term for finding patterns that fail to generalize is overfitting. Overfitting leads to unstable models that work one day, but not the next. Building stable models is the primary goal of the data mining methodology. The Model Set May Not Reflect the Relevant Population The model set is the collection of historical data that is used to develop data mining models. For inferences drawn from the model set to be valid, the model set must reflect the population that the model is meant to describe, classify, or score. A sample that does not properly reflect its parent population is biased. Using a biased sample as a model set is a recipe for learning things that are not true. It is also hard to avoid. Consider: Customers are not like prospects. Survey responders are not like nonresponders. People who read email are not like people who do not read email. People who register on a Web site are not like people who fail to register. After an acquisition, customers from the acquired company are not necessarily like customers from the acquirer. Records with no missing values reflect a different population from records with missing values. Customers are not like prospects because they represent people who responded positively to whatever messages, offers, and promotions were made to attract customers in the past. A study of current customers is likely to suggest more of the same. If past campaigns have gone after wealthy, urban consumers, then any comparison of current customers with the general population will likely show that customers tend to be wealthy and urban. Such a model may miss opportunities in middle-income suburbs. The consequences of using a biased sample can be worse than simply a missed marketing opportunity. In the United States, there is a history of redlining, the illegal practice of refusing to write loans or insurance policies in certain neighborhoods. A search for patterns in the historical data from a company that had a history of redlining would reveal that people in certain neighborhoods are unlikely to be customers. If future marketing efforts were based on that finding, data mining would help perpetuate an illegal and unethical practice. Careful attention to selecting and sampling data for the model set is crucial to successful data mining. Data May Be at the Wrong Level of Detail In more than one industry, we have been told that usage often goes down in the month before a customer leaves. Upon closer examination, this turns out to be an example of learning something that is not true. Figure 3.1 shows the monthly minutes of use for a cellular telephone subscriber. For 7 months, the subscriber used about 100 minutes per month. Then, in the eighth month, usage went down to about half that. In the ninth month, there was no usage at all. This subscriber appears to fit the pattern in which a month with decreased usage precedes abandonment of the service. But appearances are deceiving. Looking at minutes of use by day instead of by month would show that the customer continued to use the service at a constant rate until the middle of the month and then stopped completely, presumably because on that day, he or she began using a competing service. The putative period of declining usage does not actually exist and so certainly does not provide a window of opportunity for retaining the customer. What appears to be a leading indicator is actually a trailing one. Minutes of Use by Tenure 140 л- 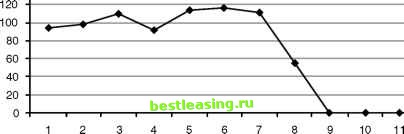 Figure 3.1 Does declining usage in month 8 predict attrition in month 9? 1 2 3 4 5 6 7 8 9 10 11 12 13 14 15 16 17 18 19 20 21 22 [ 23 ] 24 25 26 27 28 29 30 31 32 33 34 35 36 37 38 39 40 41 42 43 44 45 46 47 48 49 50 51 52 53 54 55 56 57 58 59 60 61 62 63 64 65 66 67 68 69 70 71 72 73 74 75 76 77 78 79 80 81 82 83 84 85 86 87 88 89 90 91 92 93 94 95 96 97 98 99 100 101 102 103 104 105 106 107 108 109 110 111 112 113 114 115 116 117 118 119 120 121 122 123 124 125 126 127 128 129 130 131 132 133 134 135 136 137 138 139 140 141 142 143 144 145 146 147 148 149 150 151 152 153 154 155 156 157 158 159 160 161 162 163 164 165 166 167 168 169 170 171 172 173 174 175 176 177 178 179 180 181 182 183 184 185 186 187 188 189 190 191 192 193 194 195 196 197 198 199 200 201 202 203 204 205 206 207 208 209 210 211 212 213 214 215 216 217 218 219 220 221 222 |