

|
|

|
Промышленный лизинг
Методички
Generating Hypotheses The key to generating hypotheses is getting diverse input from throughout the organization and, where appropriate, outside it as well. Often, all that is needed to start the ideas flowing is a clear statement of the problem itself-especially if it is something that has not previously been recognized as a problem. It happens more often than one might suppose that problems go unrecognized because they are not captured by the metrics being used to evaluate the organizations performance. If a company has always measured its sales force on the number of new sales made each month, the sales people may never have given much thought to the question of how long new customers remain active or how much they spend over the course of their relationship with the firm. When asked the right questions, however, the sales force may have insights into customer behavior that marketing, with its greater distance from the customer, has missed. Testing Hypotheses Consider the following hypotheses: Frequent roamers are less sensitive than others to the price per minute of cellular phone time. Families with high-school age children are more likely to respond to a home equity line offer than others. The save desk in the call center is saving customers who would have returned anyway. Such hypotheses must be transformed in a way that allows them to be tested on real data. Depending on the hypotheses, this may mean interpreting a single value returned from a simple query, plowing through a collection of association rules generated by market basket analysis, determining the significance of a correlation found by a regression model, or designing a controlled experiment. In all cases, careful critical thinking is necessary to be sure that the result is not biased in unexpected ways. Proper evaluation of data mining results requires both analytical and business knowledge. Where these are not present in the same person, it takes cross-functional cooperation to make good use of the new information. Models, Profiling, and Prediction Hypothesis testing is certainly useful, but there comes a time when it is not sufficient. The data mining techniques described in the rest of this book are all designed for learning new things by creating models based on data. In the most general sense, a model is an explanation or description of how something works that reflects reality well enough that it can be used to make inferences about the real world. Without realizing it, human beings use models all the time. When you see two restaurants and decide that the one with white tablecloths and real flowers on each table is more expensive than the one with Formica tables and plastic flowers, you are making an inference based on a model you carry in your head. When you set out to walk to the store, you again consult a mental model of the town. Data mining is all about creating models. As shown in Figure 3.3, models take a set of inputs and produce an output. The data used to create the model is called a model set. When models are applied to new data, this is called the score set. The model set has three components, which are discussed in more detail later in the chapter: The training set is used to build a set of models. The validation set1 is used to choose the best model of these. The test set is used to determine how the model performs on unseen data. Data mining techniques can be used to make three kinds of models for three kinds of tasks: descriptive profiling, directed profiling, and prediction. The distinctions are not always clear. Descriptive models describe what is in the data. The output is one or more charts or numbers or graphics that explain what is going on. Hypothesis testing often produces descriptive models. On the other hand, both directed profiling and prediction have a goal in mind when the model is being built. The difference between them has to do with time frames, as shown in Figure 3.4. In profiling models, the target is from the same time frame as the input. In predictive models, the target is from a later time frame. Prediction means finding patterns in data from one period that are capable of explaining outcomes in a later period. The reason for emphasizing the distinction between profiling and prediction is that it has implications for the modeling methodology, especially the treatment of time in the creation of the model set. 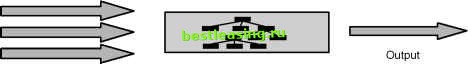 Inputs Model Figure 3.3 Models take an input and produce an output. 1 The first edition called the three partitions of the model set the training set, the test set, and the evaluation set. The authors still like that terminology, but standard usage in the data mining community is now training/validation/test. To avoid confusion, this edition adopts the training/ validation/test nomenclature. Team-Ffy® Input variables Target variable 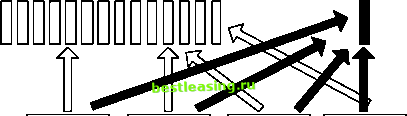 August 2004 S M T W T F S 1 2 3 4 5 6 7 8 9 10 11 12 13 14 15 16 17 18 19 20 21 22 23 24 25 26 27 28 29 30 31 September 2004 S M T W T F S 1 2 3 4 5 6 7 8 9 10 11 12 13 14 15 16 17 18 19 20 21 22 23 24 25 26 27 28 29 30 10 11 17 18 24 25 31 October 2004 T W T F S 5 6 7 8 9 12 13 14 15 16 19 20 21 22 23 26 27 28 29 30 November 2004 S M T W T F S 1 2 3 4 5 6 7 8 9 10 11 12 13 14 15 16 17 18 19 20 21 22 23 24 25 26 27 28 29 30 Input variables Target variable Figure 3.4 Profiling and prediction differ only in the time frames of the input and target variables. S M Profiling Profiling is a familiar approach to many problems. It need not involve any sophisticated data analysis. Surveys, for instance, are one common method of building customer profiles. Surveys reveal what customers and prospects look like, or at least the way survey responders answer questions. Profiles are often based on demographic variables, such as geographic location, gender, and age. Since advertising is sold according to these same variables, demographic profiles can turn directly into media strategies. Simple profiles are used to set insurance premiums. A 17-year-old male pays more for car insurance than a 60-year-old female. Similarly, the application form for a simple term life insurance policy asks about age, sex, and smoking-and not much more. Powerful though it is, profiling has serious limitations. One is the inability to distinguish cause and effect. So long as the profiling is based on familiar demographic variables, this is not noticeable. If men buy more beer than women, we do not have to wonder whether beer drinking might be the cause 1 2 3 4 5 6 7 8 9 10 11 12 13 14 15 16 17 18 19 20 21 22 23 24 [ 25 ] 26 27 28 29 30 31 32 33 34 35 36 37 38 39 40 41 42 43 44 45 46 47 48 49 50 51 52 53 54 55 56 57 58 59 60 61 62 63 64 65 66 67 68 69 70 71 72 73 74 75 76 77 78 79 80 81 82 83 84 85 86 87 88 89 90 91 92 93 94 95 96 97 98 99 100 101 102 103 104 105 106 107 108 109 110 111 112 113 114 115 116 117 118 119 120 121 122 123 124 125 126 127 128 129 130 131 132 133 134 135 136 137 138 139 140 141 142 143 144 145 146 147 148 149 150 151 152 153 154 155 156 157 158 159 160 161 162 163 164 165 166 167 168 169 170 171 172 173 174 175 176 177 178 179 180 181 182 183 184 185 186 187 188 189 190 191 192 193 194 195 196 197 198 199 200 201 202 203 204 205 206 207 208 209 210 211 212 213 214 215 216 217 218 219 220 221 222 |