

|
|

|
Промышленный лизинг
Методички
Step Eight: Assess Models This step determines whether or not the models are working. A model assessment should answer questions such as: How accurate is the model? How well does the model describe the observed data? How much confidence can be placed in the models predictions? How comprehensible is the model? Of course, the answer to these questions depends on the type of model that was built. Assessment here refers to the technical merits of the model, rather than the measurement phase of the virtuous cycle. Assessing Descriptive Models The rule, If (state=MA) then heating source is oil, seems more descriptive than the rule, If (area=339 OR area=351 OR area=413 OR area=508 OR area=617 OR area=774 OR area=781 OR area=857 OR area=978) then heating source is oil. Even if the two rules turn out to be equivalent, the first one seems more expressive. Expressive power may seem purely subjective, but there is, in fact, a theoretical way to measure it, called the minimum description length or MDL. The minimum description length for a model is the number of bits it takes to encode both the rule and the list of all exceptions to the rule. The fewer bits required, the better the rule. Some data mining tools use MDL to decide which sets of rules to keep and which to weed out. Assessing Directed Models Directed models are assessed on their accuracy on previously unseen data. Different data mining tasks call for different ways of assessing performance of the model as a whole and different ways of judging the likelihood that the model yields accurate results for any particular record. Any model assessment is dependent on context; the same model can look good according to one measure and bad according to another. In the academic field of machine learning-the source of many of the algorithms used for data mining-researchers have a goal of generating models that can be understood in their entirety. An easy-to-understand model is said to have good mental fit. In the interest of obtaining the best mental fit, these researchers often prefer models that consist of a few simple rules to models that contain many such rules, even when the latter are more accurate. In a business setting, such explicability may not be as important as performance-or may be more important. Model assessment can take place at the level of the whole model or at the level of individual predictions. Two models with the same overall accuracy may have quite different levels of variance among the individual predictions. A decision tree, for instance, has an overall classification error rate, but each branch and leaf of the tree also has an error rate as well. Assessing Classifiers and Predictors For classification and prediction tasks, accuracy is measured in terms of the error rate, the percentage of records classified incorrectly. The classification error rate on the preclassified test set is used as an estimate of the expected error rate when classifying new records. Of course, this procedure is only valid if the test set is representative of the larger population. Our recommended method of establishing the error rate for a model is to measure it on a test dataset taken from the same population as the training and validation sets, but disjointed from them. In the ideal case, such a test set would be from a more recent time period than the data in the model set; however, this is not often possible in practice. A problem with error rate as an assessment tool is that some errors are worse than others. A familiar example comes from the medical world where a false negative on a test for a serious disease causes the patient to go untreated with possibly life-threatening consequences whereas a false positive only leads to a second (possibly more expensive or more invasive) test. A confusion matrix or correct classification matrix, shown in Figure 3.11, can be used to sort out false positives from false negatives. Some data mining tools allow costs to be associated with each type of misclassification so models can be built to minimize the cost rather than the misclassification rate. Assessing Estimators For estimation tasks, accuracy is expressed in terms of the difference between the predicted score and the actual measured result. Both the accuracy of any one estimate and the accuracy of the model as a whole are of interest. A model may be quite accurate for some ranges of input values and quite inaccurate for others. Figure 3.12 shows a linear model that estimates total revenue based on a products unit price. This simple model works reasonably well in one price range but goes badly wrong when the price reaches the level where the elasticity of demand for the product (the ratio of the percent change in quantity sold to the percent change in price) is greater than one. An elasticity greater than one means that any further price increase results in a decrease in revenue because the increased revenue per unit is more than offset by the drop in the number of units sold. 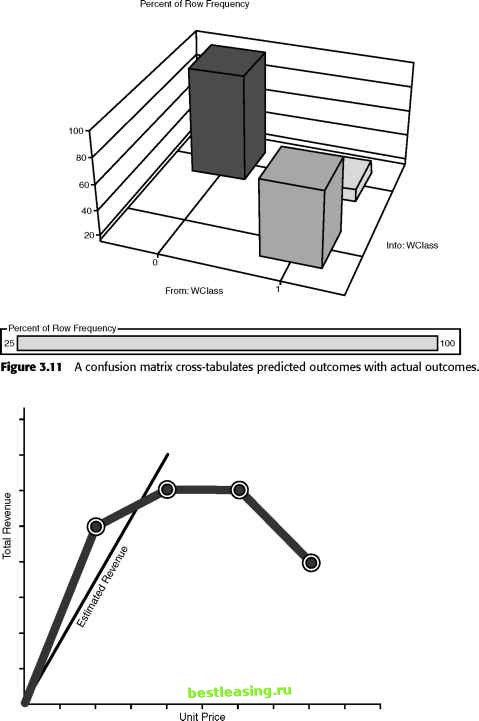 Figure 3.12 1 2 3 4 5 6 7 8 9 10 11 12 13 14 15 16 17 18 19 20 21 22 23 24 25 26 27 28 29 30 31 32 33 [ 34 ] 35 36 37 38 39 40 41 42 43 44 45 46 47 48 49 50 51 52 53 54 55 56 57 58 59 60 61 62 63 64 65 66 67 68 69 70 71 72 73 74 75 76 77 78 79 80 81 82 83 84 85 86 87 88 89 90 91 92 93 94 95 96 97 98 99 100 101 102 103 104 105 106 107 108 109 110 111 112 113 114 115 116 117 118 119 120 121 122 123 124 125 126 127 128 129 130 131 132 133 134 135 136 137 138 139 140 141 142 143 144 145 146 147 148 149 150 151 152 153 154 155 156 157 158 159 160 161 162 163 164 165 166 167 168 169 170 171 172 173 174 175 176 177 178 179 180 181 182 183 184 185 186 187 188 189 190 191 192 193 194 195 196 197 198 199 200 201 202 203 204 205 206 207 208 209 210 211 212 213 214 215 216 217 218 219 220 221 222 |