

|
|

|
Промышленный лизинг
Методички
$400,000 $200,000 ($200,000) ($400,000) ($600,000) ($800,000) ($1,000,000) 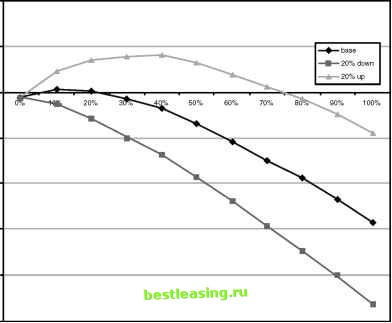 Figure 4.4 A 20 percent variation in response rate, cost, and revenue per responder has a large effect on the profitability of a campaign. Figure 4.4 shows what would happen to this campaign if the assumptions on cost, response rate, and revenue were all off by 20 percent. Under the pessimistic scenario, the best that can be achieved is a loss of $20,000. Under the optimistic scenario, the campaign achieves maximum profitability of $161,696 at 40 percent penetration. Estimates of cost tend to be fairly accurate since they are based on postage rates, printing charges, and other factors that can be determined in advance. Estimates of response rates and revenues are usually little more than guesses. So, while optimizing a campaign for profitability sounds appealing, it is unlikely to be possible in practice without conducting an actual test campaign. Modeling campaign profitability in advance is primarily a what-if analysis to determine likely profitability bounds based on various assumptions. Although optimizing a campaign in advance is not particularly useful, it can be useful to measure the results of a campaign after it has been run. However, to do this effectively, there need to be customers included in the campaign with a full range of response scores-even customers from lower deciles. WARNING The profitability of a campaign depends on so many factors that can only be estimated in advance that the only reliable way to do it is to use an actual market test. Reaching the People Most Influenced by the Message One of the more subtle simplifying assumptions made so far is that when a model with good lift is identifying people who respond to the offer. Since these people receive an offer and proceed to make purchases at a higher rate than other people, the assumption seems to be confirmed. There is another possibility, however: The model could simply be identifying people who are likely to buy the product with or without the offer. This is not a purely theoretical concern. A large bank, for instance, did a direct mail campaign to encourage customers to open investment accounts. Their analytic group developed a model for response for the mailing. They went ahead and tested the campaign, using three groups: Control group: A group chosen at random to receive the mailing. Test group: A group chosen by modeled response scores to receive the mailing. Holdout group: A group chosen by model scores who did not receive the mailing. The models did quite well. That is, the customers who had high model scores did indeed respond at a higher rate than the control group and customers with lower scores. However, customers in the holdout group also responded at the same rate as customers in the test group. What was happening? The model worked correctly to identify people interested in such accounts. However, every part of the bank was focused on getting customers to open investment accounts-broadcast advertising, posters in branches, messages on the Web, training for customer service staff. The direct mail was drowned in the noise from all the other channels, and turned out to be unnecessary. To test whether both a model and the campaign it supports are effective, track the relationship of response rate to model score among prospects in a holdout group who are not part of the campaign as well as among prospects who are included in the campaign. The goal of a marketing campaign is to change behavior. In this regard, reaching a prospect who is going to purchase anyway is little more effective than reaching a prospect who will not purchase despite having received the offer. A group identified as likely responders may also be less likely to be influenced by a marketing message. Their membership in the target group means that they are likely to have been exposed to many similar messages in the past from competitors. They are likely to already have the product or a close substitute or to be firmly entrenched in their refusal to purchase it. A marketing message may make more of a difference with people who have not heard it all before. Segments with the highest scores might have responded anyway, even without the marketing investment. This leads to the almost paradoxical conclusion that the segments with the highest scores in a response model may not provide the biggest return on a marketing investment. Differential Response Analysis The way out of this dilemma is to directly model the actual goal of the campaign, which is not simply reaching prospects who then make purchases. The goal should be reaching prospects who are more likely to make purchases because of having been contacted. This is known as differential response analysis. Differential response analysis starts with a treated group and a control group. If the treatment has the desired effect, overall response will be higher in the treated group than in the control group. The object of differential response analysis is to find segments where the difference in response between the treated and untreated groups is greatest. Quadstones marketing analysis software has a module that performs this differential response analysis (which they call uplift analysis ) using a slightly modified decision tree as illustrated in Figure 4.5. The tree in the illustration is based on the response data from a test mailing, shown in Table 4.5. The data tabulates the take-up rate by age and sex for an advertised service for a treated group that received a mailing and a control group that did not. It doesnt take much data mining to see that the group with the highest response rate is young men who received the mailing, followed by old men who received the mailing. Does that mean that a campaign for this service should be aimed primarily at men? Not if the goal is to maximize the number of new customers who would not have signed up without prompting. Men included in the campaign do sign up for the service in greater numbers than women, but men are more likely to purchase the service in any case. The differential response tree makes it clear that the group most affected by the campaign is old women. This group is not at all likely (0.4 percent) to purchase the service without prompting, but with prompting they experience a more than tenfold increase in purchasing. Table 4.5 Response Data from a Test Mailing
1 2 3 4 5 6 7 8 9 10 11 12 13 14 15 16 17 18 19 20 21 22 23 24 25 26 27 28 29 30 31 32 33 34 35 36 37 38 39 40 41 42 [ 43 ] 44 45 46 47 48 49 50 51 52 53 54 55 56 57 58 59 60 61 62 63 64 65 66 67 68 69 70 71 72 73 74 75 76 77 78 79 80 81 82 83 84 85 86 87 88 89 90 91 92 93 94 95 96 97 98 99 100 101 102 103 104 105 106 107 108 109 110 111 112 113 114 115 116 117 118 119 120 121 122 123 124 125 126 127 128 129 130 131 132 133 134 135 136 137 138 139 140 141 142 143 144 145 146 147 148 149 150 151 152 153 154 155 156 157 158 159 160 161 162 163 164 165 166 167 168 169 170 171 172 173 174 175 176 177 178 179 180 181 182 183 184 185 186 187 188 189 190 191 192 193 194 195 196 197 198 199 200 201 202 203 204 205 206 207 208 209 210 211 212 213 214 215 216 217 218 219 220 221 222 |
||||||||||||||||||||