

|
|

|
Промышленный лизинг
Методички
COMPARING MISCLASSIFICAION RATES ON TRAINING AND VALIDATION SETS The error rate on the validation set should be larger than the error rate on the training set, because the training set was used to build the rules in the model. A large difference in the misclassification error rate, however, is a symptom of an unstable model. This difference can show up in several ways as shown by the following three graphs generated by SAS Enterprise Miner. The graphs represent the percent of records correctly classified by the candidate models in a decision tree. Candidate subtrees with fewer nodes are on the left; with more nodes are on the right. These figures show the percent correctly classified instead of the error rate, so they are upside down from the way similar charts are shown elsewhere in this book. As expected, the first chart shows the candidate trees performing better and better on the training set as the trees have more and more nodes-the training process stops when the performance no longer improves. On the validation set, however, the candidate trees reach a peak and then the performance starts to decline as the trees get larger. The optimal tree is the one that works on the validation set, and the choice is easy because the peak is well-defined. 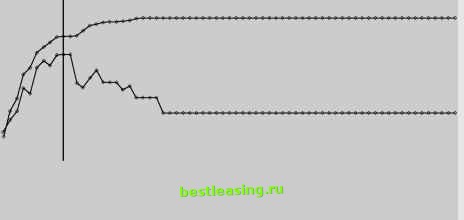 This chart shows a clear inflection point in the graph of the percent correctly classified in the validation set. COMPARING MISCLASSIFICAION RATES ON TRAINING AND VALIDATION SETS (continued) Sometimes, though, there is not clear demarcation point. That is, the performance of the candidate models on the validation set never quite reaches a maximum as the trees get larger. In this case, the pruning algorithm chooses the entire tree (the largest possible subtree), as shown in the following illustration: 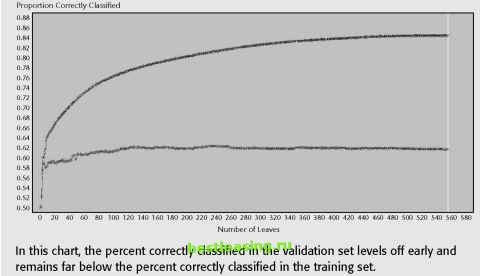 The final example is perhaps the most interesting, because the results on the validation set become unstable as the candidate trees become larger. The cause of the instability is that the leaves are too small. In this tree, there is an example of a leaf that has three records from the training set and all three have a target value of 1 - a perfect leaf. However, in the validation set, the one record that falls there has the value 0. The leaf is 100 percent wrong. As the tree grows more complex, more of these too-small leaves are included, resulting in the instability seen below: (continued) COMPARING MISCLASSIFICAION RATES ON TRAINING AND VALIDATION SETS (continued) 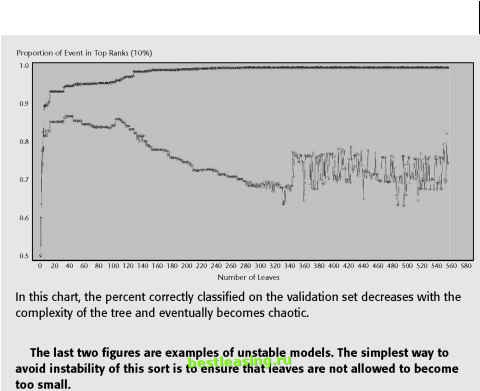 The formula for the adjusted error rate is: AE(T) = E(T) + aleaf count(T) Where a is an adjustment factor that is increased in gradual steps to create new subtrees. When a is zero, the adjusted error rate equals the error rate. To find the first subtree, the adjusted error rates for all possible subtrees containing the root node are evaluated as a is gradually increased. When the adjusted error rate of some subtree becomes less than or equal to the adjusted error rate for the complete tree, we have found the first candidate subtree, a1. All branches that are not part of a1 are pruned and the process starts again. The a1 tree is pruned to create an a2 tree. The process ends when the tree has been pruned all the way down to the root node. Each of the resulting subtrees (sometimes called the alphas) is a candidate to be the final model. Notice that all the candidates contain the root node and the largest candidate is the entire tree. 1 2 3 4 5 6 7 8 9 10 11 12 13 14 15 16 17 18 19 20 21 22 23 24 25 26 27 28 29 30 31 32 33 34 35 36 37 38 39 40 41 42 43 44 45 46 47 48 49 50 51 52 53 54 55 56 57 58 59 60 61 62 63 64 65 66 67 68 69 [ 70 ] 71 72 73 74 75 76 77 78 79 80 81 82 83 84 85 86 87 88 89 90 91 92 93 94 95 96 97 98 99 100 101 102 103 104 105 106 107 108 109 110 111 112 113 114 115 116 117 118 119 120 121 122 123 124 125 126 127 128 129 130 131 132 133 134 135 136 137 138 139 140 141 142 143 144 145 146 147 148 149 150 151 152 153 154 155 156 157 158 159 160 161 162 163 164 165 166 167 168 169 170 171 172 173 174 175 176 177 178 179 180 181 182 183 184 185 186 187 188 189 190 191 192 193 194 195 196 197 198 199 200 201 202 203 204 205 206 207 208 209 210 211 212 213 214 215 216 217 218 219 220 221 222 |