

|
|

|
Промышленный лизинг
Методички
unknown instance is fed into the network and is assigned to the cluster at the output unit with the largest weight. The network has identified clusters, but we do not know anything about them. We will return to the problem of identifying clusters a bit later. The original SOMs used two-dimensional grids for the output layer. This was an artifact of earlier research into recognizing features in images composed of a two-dimensional array of pixel values. The output layer can really have any structure-with neighborhoods defined in three dimensions, as a network of hexagons, or laid out in some other fashion. A large bank is interested in increasing the number of home equity loans that it sells, which provides an illustration of the practical use of clustering. The bank decides that it needs to understand customers that currently have home equity loans to determine the best strategy for increasing its market share. To start this process, demographics are gathered on 5,000 customers who have home equity loans and 5,000 customers who do not have them. Even though the proportion of customers with home equity loans is less than 50 percent, it is a good idea to have equal weights in the training set. The data that is gathered has fields like the following: Appraised value of house Amount of credit available Amount of credit granted Age Marital status Number of children Household income This data forms a good training set for clustering. The input values are mapped so they all lie between -1 and +1; these are used to train an SOM. The network identifies five clusters in the data, but it does not give any information about the clusters. What do these clusters mean? A common technique to compare different clusters that works particularly well with neural network techniques is the average member technique. Find the most average member of each of the clusters-the center of the cluster. This is similar to the approach used for sensitivity analysis. To do this, find the average value for each feature in each cluster. Since all the features are numbers, this is not a problem for neural networks. For example, say that half the members of a cluster are male and half are female, and that male maps to -1.0 and female to +1.0. The average member for this cluster would have a value of 0.0 for this feature. In another cluster, Example: Finding Clusters Team-Fly® there may be nine females for every male. For this cluster, the average member would have a value of 0.8. This averaging works very well with neural networks since all inputs have to be mapped into a numeric range. TIP Self-organizing maps, a type of neural network, can identify clusters but they do not identify what makes the members of a cluster similar to each other. A powerful technique for comparing clusters is to determine the center or average member in each cluster. Using the test set, calculate the average value for each feature in the data. These average values can then be displayed in the same graph to determine the features that make a cluster unique. These average values can then be plotted using parallel coordinates as in Figure 7.15, which shows the centers of the five clusters identified in the banking example. In this case, the bank noted that one of the clusters was particularly interesting, consisting of married customers in their forties with children. A bit more investigation revealed that these customers also had children in their late teens. Members of this cluster had more home equity lines than members of other clusters. 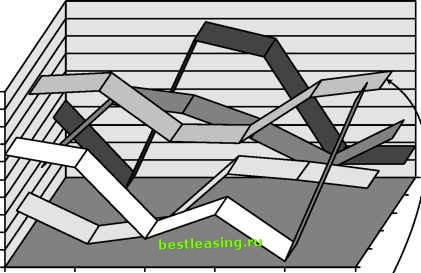 -0.2 -0.4 -0.6 -0.8 -1.0 Available Credit Credit Balance Marital Status Children Income This cluster looks interesting. High-income customers with children in the middle age group who are taking out large loans. Figure 7.15 The centers of five clusters are compared on the same graph. This simple visualization technique (called parallel coordinates) helps identify interesting clusters. The story continues with the Marketing Department of the bank concluding that these people had taken out home equity loans to pay college tuition fees. The department arranged a marketing program designed specifically for this market, selling home equity loans as a means to pay for college education. The results from this campaign were disappointing. The marketing program was not successful. Since the marketing program failed, it may seem as though the clusters did not live up to their promise. In fact, the problem lay elsewhere. The bank had initially only used general customer information. It had not combined information from the many different systems servicing its customers. The bank returned to the problem of identifying customers, but this time it included more information-from the deposits system, the credit card system, and so on. The basic methods remained the same, so we will not go into detail about the analysis. With the additional data, the bank discovered that the cluster of customers with college-age children did actually exist, but a fact had been overlooked. When the additional data was included, the bank learned that the customers in this cluster also tended to have business accounts as well as personal accounts. This led to a new line of thinking. When the children leave home to go to college, the parents now have the opportunity to start a new business by taking advantage of the equity in their home. With this insight, the bank created a new marketing program targeted at the parents, about starting a new business in their empty nest. This program succeeded, and the bank saw improved performance from its home equity loans group. The lesson of this case study is that, although SOMs are powerful tools for finding clusters, neural networks really are only as good as the data that goes into them. Lessons Learned Neural networks are a versatile data mining tool. Across a large number of industries and a large number of applications, neural networks have proven themselves over and over again. These results come in complicated domains, such as analyzing time series and detecting fraud, that are not easily amenable to other techniques. The largest neural network developed for production is probably the system that AT&T developed for reading numbers on checks. This neural network has hundreds of thousands of units organized into seven layers. Their foundation is based on biological models of how brains work. Although predating digital computers, the basic ideas have proven useful. In biology, neurons fire after their inputs reach a certain threshold. This model 1 2 3 4 5 6 7 8 9 10 11 12 13 14 15 16 17 18 19 20 21 22 23 24 25 26 27 28 29 30 31 32 33 34 35 36 37 38 39 40 41 42 43 44 45 46 47 48 49 50 51 52 53 54 55 56 57 58 59 60 61 62 63 64 65 66 67 68 69 70 71 72 73 74 75 76 77 78 79 80 81 82 83 84 85 86 87 88 89 90 91 [ 92 ] 93 94 95 96 97 98 99 100 101 102 103 104 105 106 107 108 109 110 111 112 113 114 115 116 117 118 119 120 121 122 123 124 125 126 127 128 129 130 131 132 133 134 135 136 137 138 139 140 141 142 143 144 145 146 147 148 149 150 151 152 153 154 155 156 157 158 159 160 161 162 163 164 165 166 167 168 169 170 171 172 173 174 175 176 177 178 179 180 181 182 183 184 185 186 187 188 189 190 191 192 193 194 195 196 197 198 199 200 201 202 203 204 205 206 207 208 209 210 211 212 213 214 215 216 217 218 219 220 221 222 |