

|
|

|
Промышленный лизинг
Методички
0.9 0.8 0.7 0.6 0.5 0.4 0.3 0.2 0.1 0 0 0.2 0.4 0.6 0.8 1 Figure 8.2 Perhaps the cleanest training set for MBR is one that divides neatly into two disjoint sets. 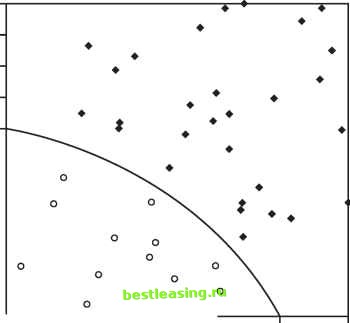 Figure 8.3 shows that only eight points in it are needed to get the same results. Given that the size of the training set has such a large influence on the performance of MBR, being able to reduce the size is a significant performance boost. How can this reduced set of records be found? The most practical method is to look for clusters containing records belonging to different categories. The centers of the clusters can then be used as a reduced set. This works well when the different categories are quite separate. However, when there is some overlap and the categories are not so well-defined, using clusters to reduce the size of the training set can cause MBR to produce poor results. Finding an optimal set of support records has been an area of recent research. When such an optimal set can be found, the historical records can sometimes be reduced to the level where they fit inside a spreadsheet, making it quite efficient to apply MBR to new records on less powerful machines. 0.9 -0.8 - 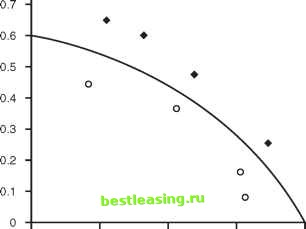 0 0.2 0.4 0.6 0.8 1 Figure 8.3 This smaller set of points returns the same results as in Figure 8.2 using MBR. Determining the Distance Function, Combination Function, and Number of Neighbors The distance function, combination function, and number of neighbors are the key ingredients in using MBR. The same set of historical records can prove very useful or not at all useful for predictive purposes, depending on these criteria. Fortunately, simple distance functions and combination functions usually work quite well. Before discussing these issues in detail, lets look at a detailed case study. Case Study: Classifying News Stories This case study uses MBR to assign classification codes to news stories and is based on work conducted by one of the authors. The results from this case study show that MBR can perform as well as people on a problem involving hundreds of categories and data on a difficult-to-use type of data, free-text.1 This case study is a summarization of research conducted by one of the authors. Complete details are available in the article Classifying News Stories using Memory Based Reasoning, by David Waltz, Brij Masand, and Gordon Linoff, in Proceedings, SIGIR 92, published by ACM Press. What Are the Codes? The classification codes are keywords used to describe the content of news stories. These codes are added to stories by a news retrieval service to help users search for stories of interest. They help automate the process of routing particular stories to particular customers and help implement personalized profiles. For instance, an industry analyst who specializes in the automotive industry (or anyone else with an interest in the topic) can simplify searches by looking for documents with the automotive industry code. Because knowledgeable experts, also known as editors, set up the codes, the right stories are retrieved. Editors or expert systems have traditionally assigned these codes. This case study investigated the use of MBR for this purpose. The codes used in this study fall into six categories: Government Agency Industry Market Sector Product Region Subject The data contained 361 separate codes, distributed as follows in the training set (Table 8.2). The number and types of codes assigned to stories varied. Almost all the stories had region and subject codes-and, on average, almost three region codes per story. At the other extreme, relatively few stories contained government and product codes, and such stories rarely had more than one such code. Table 8.2 Six Types of Codes Used to Classify News Stories
1 2 3 4 5 6 7 8 9 10 11 12 13 14 15 16 17 18 19 20 21 22 23 24 25 26 27 28 29 30 31 32 33 34 35 36 37 38 39 40 41 42 43 44 45 46 47 48 49 50 51 52 53 54 55 56 57 58 59 60 61 62 63 64 65 66 67 68 69 70 71 72 73 74 75 76 77 78 79 80 81 82 83 84 85 86 87 88 89 90 91 92 93 94 95 [ 96 ] 97 98 99 100 101 102 103 104 105 106 107 108 109 110 111 112 113 114 115 116 117 118 119 120 121 122 123 124 125 126 127 128 129 130 131 132 133 134 135 136 137 138 139 140 141 142 143 144 145 146 147 148 149 150 151 152 153 154 155 156 157 158 159 160 161 162 163 164 165 166 167 168 169 170 171 172 173 174 175 176 177 178 179 180 181 182 183 184 185 186 187 188 189 190 191 192 193 194 195 196 197 198 199 200 201 202 203 204 205 206 207 208 209 210 211 212 213 214 215 216 217 218 219 220 221 222 |