

|
|

|
Промышленный лизинг
Методички
TableII {continued) Panel C: Average Change in Target Price (DTP/TP 1) and Corresponding Price Appreciation To Recommendation From Strong Sell/Strong Recommendation Buy Buy Hold Sell
recommendation, stock prices appreciated on average by 2.4 percent.9 Finally, we note that in the case of recommendation reiterations, the magnitude of target price revisions is lower than in recommendation upgrades or downgrades. We have also calculated statistics, as in Panels B and C, for the variation in earnings revisions by stock recommendation revisions (unreported). We ind that, similar to the results in these panels, earnings revisions are monotonically related to the favorableness of the recommendation change. The fact that revisions in target prices, recommendations, and earnings forecasts occur generally in the same direction suggests that, to some extent, these signals share much of the same information content. In Section II we explore whether the information in each of these signals subsumes the information in any other. II. Market Reaction to Target Price Announcements A. Unconditional Informativeness ofTarget Prices In this section, we examine whether the information content of target price announcements is associated with abnormal returns around those announcements. Speciically, we compute the abnormal return around each announcement and present average abnormal returns for portfolios ranked on the basis of the magnitude of the relevant information content measure. Abnormal return is computed as the diference between a irms buy-and-hold return and the buy-and-hold return on the NYSE/AMEX/Nasdaq value-weighted market index over the period beginning two days prior and ending two days subsequent to the irms target price announcement.10 These results are reported in Figure 1. 9 The average contemporaneous market return for all recommendation categories is approximately three percent. 10 Results for the period of 1to +1 days around the announcement are qualitatively similar. Also, to avoid possible cross-correlation problems caused by identical return observations, we delete all but one of identical return observations within each portfolio. -о а -1.0 -2.0 -3.0 -4.0 -5.0 Buy-and-hold abnormal return for portfolios ranked by TP/P Buy-and-hold abnormal return for portfolios ranked by ATP/P 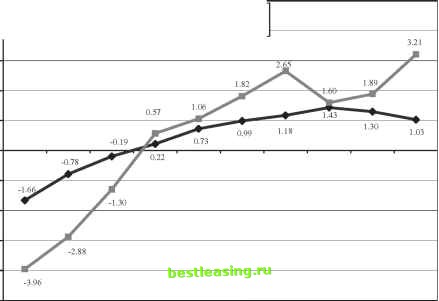 Lowest Highest Portfolios deciles by target price level/revision Figure 1. Average buy-and-hold abnormal return around announcements of target prices. This figure depicts average buy-and-hold abnormal returns for the period from two days prior to through two days subsequent to the announcement of target price for decile portfolios ranked on the basis of two target price information measures. Abnormal returns are computed as the diference between the irm buy and hold return and the buy and hold return on the NYSE/AMEX/Nasdaq value weight index. The information content measures are (a) the ratio of target price to preannouncement stock price (stock price outstanding two days prior to the announcement of the target price), denoted (TP/P), and (b) the change in the individual brokerage house target price scaled by preannouncement stock price, denoted (DTP/P).To avoid a possible cross-correlation problem caused by identical return observations, we delete all but one of identical return observations within each portfolio. The visual evidence in Figure 1 indicates that average abnormal returns around target price revisions are increasing in the favorableness of the target price and its revision. For example, the average abnormal return for portfolios ranked on the basis of the ratio of announced target price to the stock price outstanding two days prior to the announcement, TP/P, ranges from an average of - 1.66 percent for the least favorable target price revision to 1.03 percent for the most favorable one. A larger spread in abnormal returns is associated with portfolios ranked on the basis of the revision in the individual brokerage house target price, with average abnormal returns ranging from - 3.96 percent to 3.21 percent for the least and most favorable revisions, respectively. While unreported, differences in average abnormal returns are highly statistically signiicant.11 Combining these indings with those in the extant literature of a signiicant positive (negative) price reaction to favorable (unfavorable) stock recommendations (e.g., Stickel (1995), Womack (1996)) and earnings forecast revisions (Givoly and Lakonishok (1979), Elton, Gruber, and Gultekin (1981), Lys and Sohn (1990), Francis and Soffer (1997)) provides preliminary evidence that investors perceive analyst price targets as informative signals regarding a irms value. Furthermore, it raises an interesting question regarding the incremental information content of target prices in the presence of recommendation and earnings forecast revisions. We therefore extend our analysis, in Section II.B, below, to determine whether target price revisions are incrementally informative. B. Informativeness of Target Prices Conditional on Stock Recommendation and Earnings Forecast Revisions Table III provides regression results relating event-day abnormal returns to recommendation changes, earnings forecast revisions, and the target price revision measure DTP/P. We begin by regressing event-day abnormal returns (AR) on three recommendation revision categories, earnings forecast revision, DF/P, and target price revision DTP/P.12 Our goal is to determine whether target price revisions are informative, controlling for recommendation and earnings forecast revisions. The regression takes the form AR = 1 UPGRADES + (DOWNGRADES+(REITERATIONS where the indicator variables- UPGRADES, DOWNGRADES, REITERATIONS-take the value 1 if the stated recommendation revision is met and 0 otherwise. The regression results reported in column 1 of Panel A indicate that target price revisions are positively and signiicantly related to event-day abnormal returns (g = 3.705 with t-statistic = 38.7), controlling for the information in the associated stock recommendation and earnings forecast revisions. Economically, a 11 In unreported results we perform two robustness tests. In the irst, we examine whether earnings announcements drive the documented average returns around target price announcements. Toward this end, we exclude from the abnormal return calculation observations that fall within a ive-day window of an earnings announcement. The results are qualitatively the same. (This result is also consistent with Womack (1996), who finds that the majority of recommendation changes are not in response to earnings releases.) In the second test, to account for the possibility that the documented abnormal return is caused by other irm-speciic events immediately prior to the target price announcement, we calculate abnormal returns starting at day 0 through day + 2. The results remain unchanged. 12 We exclude from the analysis sell or strong sell recommendations because of the small number of such observations. 1 2 3 [ 4 ] 5 6 7 8 9 10 11 12 |