

|
|

|
Промышленный лизинг
Методички
the returns ofsmall growth irms, and that the portfolio intercept, 0.799 percent, is large both economically and statistically.When we consider irms in the lowest tercile of target price revisions, we ind that the portfolio covaries with the returns of small, value irms but ind no evidence of abnormal performance. This evidence is consistent with the view that over our sample period small growth irms exhibited strong price appreciation whereas value stocks in general performed poorly. In the case ofrecommendation reiterations, we still ind strong evidence ofab-normal performance for the high target price revision. The other portfolios in this case yield insigniicant estimates of abnormal returns. Much like with recommendation upgrades, it can be seen that the high target price revision portfolio tends to comove with the returns of small, low book-to-market irms, while the lowest target price revision portfolio returns covary with the returns of small value irms. Finally, the evidence within recommendation downgrades is consistent with the event-time analysis, with insigniicant intercepts for both highest and lowest target price revisions. Interestingly, the estimated factor loadings for irms with a recommendation downgrade indicate that the key diference between irms with the lowest and highest target price is their exposure to the momentum factor. While both sets of irms comove with the returns of small growth irms, those that receive an upward (downwards) revision to their target price behave like other winner (loser) irms.19 The abnormal return evidence presented in this section is consistent both with an irrational underreaction interpretation (e.g., Jegadeesh and Titman (1993)) and with rational learning (Brav and Heaton (2002)). We caution, however, that our three-year sample period coincides with the highs of the bull market in the United States, which might be viewed historically as an unusual period. Therefore, an alternative viable view is that the evidence of postevent returns is unique to this period and unlikely to persist as more data becomes available. We leave for future research a detailed study of these explanations. III. Modeling the Long-term Relation between Market and Target Prices We extend the analysis in Section II with an investigation of the long-term dynamics of the stock and target prices. Our objectives are to further investigate the extent to which analyst price targets are systematically related to irms fundamental values and to quantify the low-frequency dynamics ofthese price series. Because both sets of prices are nonstationary, we employ a cointegration framework and estimate the linear combination ofthe price series that is stationary. This linear combination is termed as the price systems long-term relation 19 In additional unreported tests, we repeat the regression analysis but with value-weighted portfolio returns. Speciically, we construct our portfolios as explained above but weigh the component monthly returns with the lagged market capitalization of the constituent firms. We ind that across the three recommendation classiications, the pattern of positive (negative) performance subsequent to a high (low) revision in the target price is qualitatively the same as in Table V. and is parameterized as the ratio of target and market prices.20 Since target prices are predominantly one-year-ahead prices, this ratio can be interpreted as the analysts estimate of the firms ex ante return. Cointegration also implies that any price deviations from the long-term ratio are stationary as well. That is, if on a given date the ratio of the two prices is equal to the long-term relation, then a shock to any of the variables will lead to a price path that will settle back to the long-term relation. We analyze the price systems reaction to deviations from this long-term ratio by examining which price series corrects to the long-term relation, once the system has been perturbed away. That is, are analysts the ones reacting to a deviation from the long-term relation by adjusting their target prices, or, do stock prices contribute towards most of the adjustment? Our empirical analysis is conducted on a time series ofindividual irms weekly stock prices and consensus target prices. Consensus target price is calculated as the average target price across all brokerage houses. Target prices outstanding for more than 90 days are excluded from the consensus. We choose a weekly interval to avoid microstructure problems associated with daily data. Given the long-term nature of the cointegration analysis, we require each irm to have a minimum of 500 trading days (approximately 104 consecutive weeks) with continuous stock and target price data.21 The final sample consists of 900 firms. To set the stage for our methodological approach and to build intuition for the full-sample analysis, we begin by examining the joint price behavior of a single firm, IBM. A. Basic Setup and Application to IBMs Stock and Target Price Behavior Figure 2 depicts the time series of weekly market prices for IBM over our sample period, January 1997 through December 1999. We also plot the weekly consensus target price and the ratio of target to market price, denoted TP/P. Inspection of this igure provides a key insight. While both price series are nonstationary (we are unable to reject the null of nonstationarity with an augmented Dickey-Fuller test), it is evident that market and target prices share a long-run common 20 Our use of the term long-term relation differs from that used in the traditional cointe-gration literature (Engle and Granger (1987)) in which the term long-term equilibrium has been employed. The motivation for the use of the latter term is the idea that when two coin-tegrated economic variables drift apart from this equilibrium, economic forces eventually drive them back to it (e.g., Lee, Myers, and Swaminathan (1999), Hasbrouck (2002)). Finally, as Campbell and Shiller (1988) argue, such an equilibrium can occur simply because one variable is a rational expectation of the future value of another variable that follows an integrated process. Since target prices are, by deinition, analysts forecasts of future prices, we have therefore chosen to avoid using the term long-term equilibrium in our analysis in favor of long-term relation. 21 While the choice of a two-year minimum period reduces the number of irms that we can study, it is a necessary requirement, as we are interested in studying the long-term dynamics of target and market prices. We have replicated the cointegration analysis using a minimum of 250 trading days and obtained similar results. In addition, the analysis was conducted on size-sorted portfolios containing all irms in our database. Our conclusions regarding the dynamics of market and target prices remain unchanged. 160 140 120 100 80 60 40 20 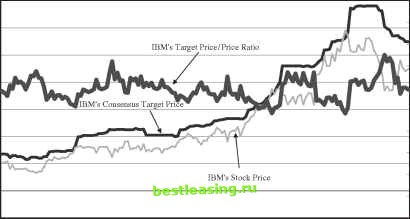 1.8 1.6 1.4 1.2 0.8 0.6 0.4 0.2 О.-irn.-ICSO-iCSOOJO-iCSO-iCSOOJO-iCSO-1ГП.-ICS .-icsmin4oooo\ocs--irnxfintooc--icscsmxfotooo-- 00000001100000001100000011 Date Figure 2. IBMs weekly stock price, target price, and target price-to-price ratio. This figure depicts weekly market price and consensus target price for IBM. The market prices are from CRSP and the weekly consensus target price is the average of all outstanding target prices issued over the preceding 90 days. All target prices are from the First Call database. We also plot the ratio of the target price to market price at each point in time, denoted by TP/P. The vertical axis on the left-hand side corresponds to the price series while the axis on the right-hand side corresponds to the TP/P ratio. a relation. This association is captured by our third variable, TP/P. It can be seen that target prices, which are forward looking, are consistently higher than current market prices, but that the ratio of the two price series fluctuates about a common value at approximately 1.2 (see the right-hand-side vertical axis). When either price series deviates from this ratio, the system tends to revert back to this value over time. Using a cointegration approach (Engle and Granger (1987)), we provide direct evidence regarding both the long-term relation and the manner with which these prices correct toward this long-term relation.To do that, we assume that analysts ex ante expected return, and therefore the mean of the TP/P ratio, is constant over our sample period. We denote the time t target price by tpt and the market price by pt.The (2 x 1) vector xt has elements tpt andpt. Both variables are assumed integrated of order one, that is, stationary after first differencing. Cointegration ofthe two price series means that there is a (2 x 1) vector b such that the following linear relationship holds: bxt = 0.22 22 We have conducted Johansens cointegration rank test for each of the 900 price series that we later study in Section III.C and find that we are able to reject the null of no cointegration essentially for all irms. 1 2 3 4 5 6 7 [ 8 ] 9 10 11 12 |