

|
|

|
Промышленный лизинг
Методички
eminent was actually running a budget surplus and using the extra cash to buy back lots of its bonds. During the technology bubble, the government was raking in lots of taxes (often paid on stock market gains). Surprisingly, some economists thought that the U.S. debt was becoming too small! They feared that persistent U.S. government budget surpluses would lead to paying off the entire national debt and make U.S. Treasury bonds extinct. This could cause problems because some investors buy U.S. Treasury bonds as key parts of their financial strategy (e.g., insurance companies). As we see in Figure 4.1, the fear of government surpluses leading to a debt shortage was unfounded. In an amazingly short time, the fear of government surpluses evaporated and we have returned to the good old days of deficit spending. In just four years, the budget swung from a surplus of more than $200 billion to a projected deficit in excess of $500 billion. Pillar #2: Loose Money After the stock market bubble popped, the Federal Reserve cut interest rates dramatically to soften the economic pain. The popular press believes that monetary policy can come to our rescue. Alan Greenspan is often $300 $200 $100 $0 -$100 -$200 -$300 -$400 -$500 -$600
* part of year FIGURE 4.1 Uncle Sam the Borrower Source: Office of Management and Budget called the second most powerful person in the United States. Every statement by the Federal Reserve is scrutinized for the slightest nuance of monetary policy. Pillar #3: Consumer Spending Every month the government reports on American consumer spending. Wall Street cheers every report showing that we are continuing to spend like 1920s bootleggers and boos any hint of frugality. The assumption is that the more the U.S. consumer spends, the better for the U.S. economy. Can a country really become rich by spending more than it earns and by printing money? No. Government deficits promote waste. Loose money creates inflation, not wealth. Finally, it is possible for consumers to spend too little (e.g., Japan), but the U.S. personal savings rate is close to zero. If profligacy and printing presses were the way to grow an economy, then many countries that are now bankrupt would be economic superpowers. Similarly, seven years of fat, drunk, and stupid would be a good start to college. Bear #2: Financial Hangover When I was a graduate student, I played on the Harvard Ultimate Frisbee team. One of our rivals, Williams College, had an excellent team for some years until most of their star players graduated in the same class. The next year, the Harvard team destroyed Williams. In their dazed and defeated state, the Williams players gathered to regroup. One of the optimistic players said, We can learn and improve, to which another responded, But who is left to teach us? The pessimistic answer: no one. The financial hangover argument looks at the purchasers of U.S. products and asks who will buy? The pessimistic answer: no one. To make the effects of financial hangover clear, Figure 4.2 classifies the purchasers of U.S. production. The diagram looks at actual purchases. For example, the money that the government collects for social security is almost immediately sent back from the government to individuals. Thus, social security taxes collected by the government are counted in the U.S. consumer category. Similarly, U.S. consumers purchases of foreign goods are not included. There are four major groups of purchasers of U.S.-made products and services. Well look at the financial health of these four groups of buyers and see that most buyers are not in a position to increase purchases: (1) U.S. consumers; (2) U.S. businesses; (3) foreigners; and (4) governments. U.S. Consumers Consumer spending is driven by both wealth and income. That is, how rich we are and how much we earn. Government 18% Exports 10% 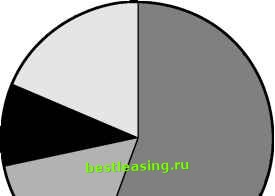 U.S. Consumers 56% Investment 16% Figure 4.2 Buyers of U.S. Output Source: U.S. Department of Commerce Estimates, 2004 1 2 3 4 5 6 7 8 9 10 11 12 13 14 15 16 17 18 19 20 21 22 23 24 [ 25 ] 26 27 28 29 30 31 32 33 34 35 36 37 38 39 40 41 42 43 44 45 46 47 48 49 50 51 52 53 54 55 56 57 58 59 60 61 62 63 64 65 66 67 68 69 70 71 72 73 74 75 76 77 78 79 80 81 82 83 84 85 86 87 88 89 90 91 92 93 94 95 96 97 98 99 100 101 102 103 104 105 |
||||||||||||||||||||