

|
|

|
Промышленный лизинг
Методички
/ . .\oiilincarilirs 111 li пат ml I lata 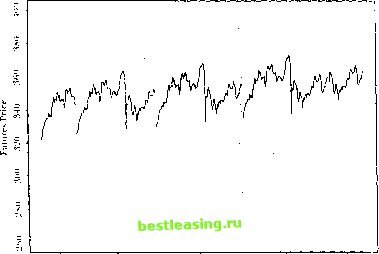 Si-iS.l MarIO J-uimis (ioiiinui JunOO .SrpIO Figure 12.11, typical Siiniiluleil Training Ialli (see Ihe lexl for Jmrnmrlrrs) Dashed line represents sloth juice, while Ihe arrows represent the options on Ihe slock, lite y-roortlinalr of the tip if the arrow indicates the strike price (allows are slanted lo make dif/eienl inlrotlntlion and expiration dales visible). of option prices and deltas dial arc difficult to distinguish visually from the true Black-Scholes values. An example of the estimates and errors for an RISK network is shown in figure 12.12. The estimated equation for this particular R\W network is C./X = 59.79 -0.03 -0.03 10.21 I/X - 1.35 т - 0.45 - 0.03 -I- 0.03 P/X - I. IS г - 0.2-1 50.70 -0.03 -0.03 10.2-1  + 1.07 .V - 0.ЧН т -f 0.20 50.70 -0.03 -0.03 10.24 .V - 0.9K т + 0.20 + 0.00 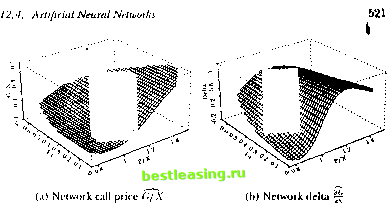 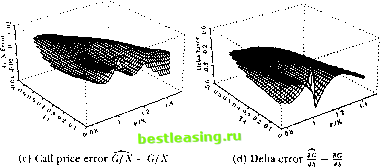 Figure 12.12. Typical Behavior of Four-Nonlinear-Term RBF Model + 0.10 P/X- 1.05 r +0.10 59.79 -0.03 -0.03 10.24 P/X- 1.05] r+0.10 + 1.62 + 0.14P/X-0.24r -0.01, (12.4.111) where x = T-t. Observe from (12.4.11) that the centers in the RJ3F model are not constrained to lie within the range of the inputs, and in fact do not in the third and fourth centers in this example. The largest errcjrs in these networks tend to occur at the kink-point for options at the money at expiration, and also along the boundary of the sample points. While the accuracy of the learning network prices is obviously of great interest, this alone is not sufficient to ensure the practical relevance of the nonparametric approach. In particular, the ability to hedge an option position is as important, since the very existence of an arbitrage-based pricing formula is predicated on the ability to replicate the option through a dynamic hedging strategy (sec the discussion in Chapter 9). This additional  v wln fact, il is well known lhat ihe problem of numerical differentiation is ill-posed. The tYavsical approach IRcinsrh (I.H>7)1 is lo regularize il by linding a sufficiently smooth function tnat solves the variational problem in (12.4.7). As we discussed earlier, RDF networks as well at splines and several forms ot Ml.l networks follow directly from the legularization approach a id are therefore expected to approximate not only the pricing formula but also its derivatives (provided the basis function corresponding lo a smoothness prior is ola sufficient degree, see tnggio and Girosi (1990): in particular, the Gaussian is certainly sufficiently smooth for our ploblem). Л special case of this general argument is the result of Gallant and While (1992) and tiornik, Stinchcombe, and White (1990) who show that singlc-hiddeti-laye: Ml.P netwoiks can approximate the derivative of an arbitrary nonlinear mapping arbitrarily well as the number of hidden units increases. strutted, that can provide real-time estimates of approximation errors in much the same way that standard errors may be obtained for typical statistical estimators. And finally, the need for belter performance measures is clear. While-typical measures of goodness-ol-lit such as If do oiler some guidance for model selection, they are only incomplete measures of performance. Moreover, the notion of degrees of freedom is no longer well-defined for nonlinear models, and this has implications for all statistical measures of lil. 12.5 OverFitting and Data-Snooping While each of the nonlinear methods discussed in this chapter has its own costs and benefits, the problems of overfilling and data-snooping ailed all of them to the same degree. Overfilling occurs when a model fits too well, in the sense that the model has captured both random noise as well as genuine nonlinearities. Heuristically, the primary source of overfilling is having too few degrees of freedom or loo many parameters relative to the number ol datapoints, and a typical symptom is an excellent in-sample fit but poor otit-of-sample performance.2* Data-snooping is a related problem that can lead to excellent but spurious out-of-sample performance. Data-snooping biases arise when wc ignore the fact dial many specification searches have been conducted to obtain the final specification of a model wc arc fitting to the data.21 F.vcn if a model is in fact incorrect, by searching long enough over various dalasets and/or parameter values, wc are likely to find some combination that will lil die dala. However, ibis fu is spurious ami is merely a symptom of our extensive search procedure. Unfortunately, there are no simple remedies to these two problems since die procedures that give rise to them are the same procedures that produce genuine empirical discoveries. The source of both problems is the inability to perform controlled experiments and, consequently, the heavy reliance on statistical inference for our understanding of the dala. As with all forms of statistical inference, there is always a margin of error, and this margin is often sensitive to small changes in the way wc process the data and revise our models. flic degrees of Ireedom of a nonliueai model are olien (lillie nil to iletet mine Ix-cause the notion of a parameter may be binned, for example, the kernel regression may seem to have only one free parameter-the bandwidth h-but ibis is clearly misleading since each dalapoint serves as a center for local averaging. See 11.impel (I <* (>) and Wahba (199(1) lor fin thei discussion. -Sec Learner (1978) and I.о and MacKinlay (1990b) lor lotiual aitalvsesot sin It biases, and Шаек (199.4) for a recent example in the tin.line literatiiie. constraint provides additional motivation for rcgularizadon techniques and, ipecifically, the RBF networks used by Hutchinson, Lo, and Poggio (1994). In particular, delta-hedging strategies require an accurate approximation of the derivative of the underlying pricing formula, and the need for accurate approximations of derivatives leads directly to the smoothness Constraint imposed by rcgularization techniques such as RBF networks.22 Hutchinson, Lo, and Poggio (1994) show that both RBF and MLP networks provide excellent delta-hedging capabilities for the simulated Black-Scholes data as well as in an empirical application to S&P 500 futures options, in a few cases outperforming the Black-Scholes formula (recall that the formula is derived under the assumption that delta-hedging is performed continuously, whereas these simulations assume daily delta-hedging). Although parametric derivative pricing formulas are preferred when they are available, the results of Hutchinson, Lo, and Poggio (1994) show that nonparametric learning-network alternatives can be useful substitutes when parametric methods fail. While their findings arc promising, we cannot yet conclude that such an approach will be successful in general-their simulations have focused only on the Black-Scholes model, and their empirical application consists of only a single instrument and time period, S&P 500 futures options for 1987 to 1991. However, this general approach points to a number of promising directions for future research. Perhaps the most pressing item on this agenda is the specification of additional inputs, inputs that are not readily captured by parametric models, e.g., the return on the market, general market volatility, and other measures of business conditions. Other research directions arc motivated by the need for ргоцег statistical inference in the specification of learning networks. First, we require some method of matching the network architecture-number of nonlinear units, number of centers, type of basis functions, etc.-to the specific datasel al hand in some optimal and, preferably, automatic fashion. Second, the relation between sample size and approximation error should be explored, cither analytically or through additional Monte Carlo simulation experiments. Perhaps some data-dependent metric can be con- 12. Nonlinearilies in Financial Data Nevertheless, there arc several ways to mitigate the effects of overfilling and data-snooping. Kor example, the impact ol systematic specification searches may often he calculated explicitly, as in l.o and MacKinlay (ИШЬ). In such instances, using a corrected statistical distribution for inference will safeguard against finding significant results where none exist. Careful out-ol-sample performance evaluation can uncover overfilling problems, and ii relatively few oitt-of-sainple tests are conducted, or if diey are conducted over different (and weakly correlated) datasets, this will minimize the effects of data-snooping. But perhaps the most effective means of reducing the impact of overfilling and data-snooping is lo impose sonic discipline on the specification search by а /топ theoretical considerations. These considerations may be in the form of well-articulated mathematical models of economic behavior, or behavioral models motivated by psychological phenomena, or simply heuristic rules of thumb based on judgment, intuition, and past experience. While all of these sources are also affected by data-snooping and overfilling to some extent-no form of inference can escape these problems-they are less susceptible and offer a less data-dependent means of model validation. ЛИ this suggests the need for an n priori framework or specification lor the model before confronting the data. By proposing such a specification, along with the kinds of phenomena one is seeking to capture and the relevant variables to be used in die search, the chance of coming upon a spuriously successful model is reduced. 12.6 Conclusion Nonlinearilies are dearly playing a more prominent role in financial applications, thanks to increases in computing power and the availability of large datasets. Unlike the material presented in earlier chapters, some of the ideas in this chapter are less well-established and more tentative. Within a short time many of the let liniqucs we have covered will be refined, and some may become obsolete. Neverlheless, il is important to develop a sense of die direction of research and the open questions to be addressed, especially al ihe early stages of these explorations. Despite the llexibility of the nonlinear models we have considered, they do have some serious limitations. They are typically more difficult to estimate precisely, more sensitive to outliers, numerically less stable, and more prone lo overfilling and data-snooping biases than comparable linear models. Contrary to popular belief, nonlinear models require more economic structure and a priori considerations, not less. And their interpretation often requires more effort and care. 1 lowever, nonlinearilies are often a fan of economic life, and for many financial applications die sources and nature Problems of nonlinearity can be readily identified or, at the very least, characterized in some fashion. In such situations, the techniques described in this chapter are powerful additions to the armory of the financial econometrician. Problems-Chapter 12 12.1 Most pseudorandom number generators implemented on digital computers are multiplicative linearcongruenlialgenerators (MLCG), in which X j = (rtX i + r) mod rn, where a is some well-chosen multiplier, с is an optional constant, and m is equal to or slightly smaller than the largest integer thjat can be represented in one computer word. (For example, let a = 166452J5, с = 0, and m = 232.) In contrast to MLCG numbers, consider the following two nonlinear recursions: the tent map (see Section 12.1.1) and the logistic map, respectively: 2X i ifX,. i < h . , X0 € (0,1) (12.6.1) 2(1-X ,) ifX , > I 4X ,(1 -X ,), X. € (0,1). (12.6.2) These recursions are examples of chaotic systems, which exhibit extreme sensitive dependence to initial conditions and unusually complex dynamic behavior. 12.1.1 What are good properties for pseudorandom number generators to have, and how should you make comparisons between distinct generators in practice (not in theory)? 12.1.2 Perform various Monte Carlo simulations comparing MLCG to the tent and logistic maps to determine which is the better pseudorandom number generator. Wbich is better and why? In deciding which criteria to use, think about the kinds of applications for which you will be using the pseudorandom number generators. Hint: Use 1.99999999 instead of 2 in your implementation of (12.6.1), and 3.99999999 instead of 4 in your implementation of (12.6.2)-for extra credit: Explain why. 12.2 Estimate a multilayer perceptron model for monthly returns on the S&P 500 index from 1926:1 to 1994:12 using five lagged returns asinputs and one hidden layer with ten units. Calculate the in-sample root-mean-squared-error (RMSE) of the one-step-ahead forecast of your model and compare it to the corresponding out-of-sample results for the test period 1986:1 to 1994:12. (iin you explain the differences in performance (if any)? 1 2 3 4 5 6 7 8 9 10 11 12 13 14 15 16 17 18 19 20 21 22 23 24 25 26 27 28 29 30 31 32 33 34 35 36 37 38 39 40 41 42 43 44 45 46 47 48 49 50 51 52 53 54 55 56 57 58 59 60 61 62 63 64 65 66 67 68 69 70 71 72 73 74 75 76 77 78 79 80 81 82 83 84 85 86 87 [ 88 ] 89 90 91 92 93 94 95 96 97 98 99 100 101 102 103 |